Capecitabine Tablet, Film Coated
Product Images NDC 68001-488

View Photos of Packaging, Regulatory Labels, and Product Appearance

Product Visual Gallery

This gallery contains 10 technical images submitted to the FDA as part of the official labeling for Capecitabine (NDC 68001-488). Unlike standard consumer photos, these assets often include clinical data figures, molecular chemical structures, and official manufacturer packaging layouts.

As provided by Bluepoint Laboratories, these visuals offer a comprehensive scientific overview of the product's physical and chemical identity, aiding pharmacists and researchers in product verification and study.

FDA Label Image

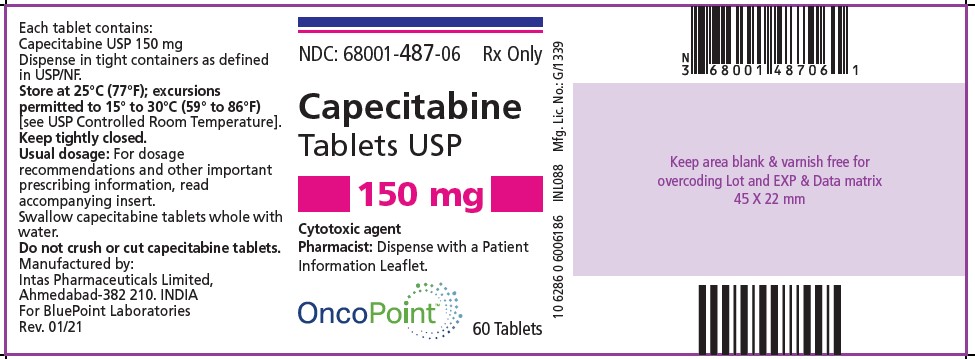
Capecitabine Tablets Usp 150mg (ndc 68001 487 06) Rev 0921 Intas Pharmez Site

Capecitabine Tablets Usp 150mg (ndc 68001 487 06) Rev 0921 Intas Pharmez Site
Label for Capecitabine Tablets USP 150 mg, film-coated oral tablets. The label includes storage instructions, dosage warnings, and manufacturing details by Intas Pharmaceuticals for BluePoint Laboratories. The package contains 60 tablets. Barcode and area reserved for lot and expiration data are also visible.*
FDA Label Image

Capecitabine Tablets 150mg 60's Bottle Label (Capecitabine 150 Label)

Capecitabine Tablets 150mg 60's Bottle Label (Capecitabine 150 Label)
Label for Capecitabine Tablets USP 150 mg film-coated oral tablets by BluePoint Laboratories, containing 60 tablets per package. The label includes storage instructions, dosage recommendations, and manufacturer information from Intas Pharmaceuticals Limited. It also notes the product as a cytotoxic agent and specifies pharmacist dispensing guidelines.*
FDA Label Image

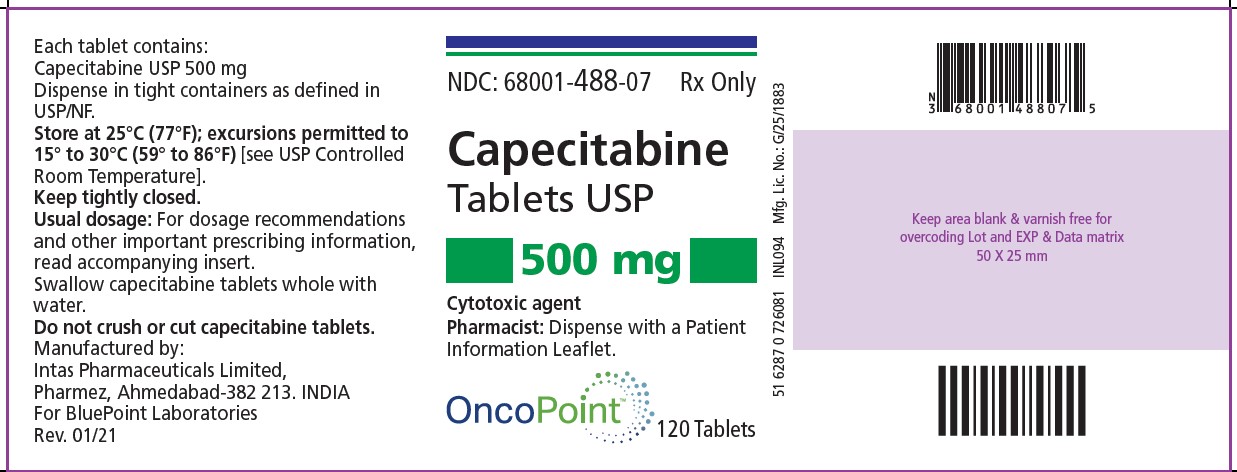
Capecitabine Tablets 500mg 120's Bottle Label (Capecitabine 500 Label)

Capecitabine Tablets 500mg 120's Bottle Label (Capecitabine 500 Label)
Capecitabine 500 mg tablets USP film-coated oral dosage form packaging label. The label indicates the product is a cytotoxic agent, contains 120 tablets, and is distributed by BluePoint Laboratories. The label includes storage instructions, manufacturer details (Intas Pharmaceuticals Limited, India), and a barcode. The proprietary and generic name is Capecitabine.*
FDA Label Image

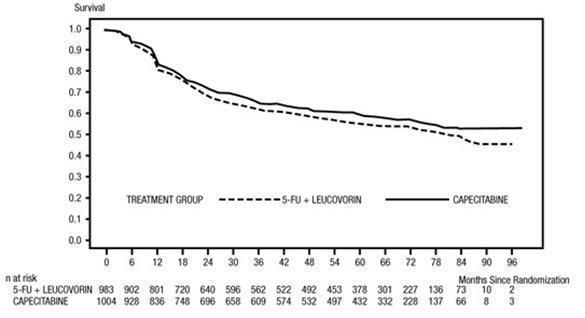
Figure 1 (Capecitabine Fig1)

Figure 1 (Capecitabine Fig1)
A survival curve chart comparing two treatment groups over time in months since randomization. The chart plots survival probability on the y-axis against time on the x-axis, showing solid and dashed lines for Capecitabine and 5-FU + Leucovorin groups respectively, with corresponding sample sizes listed for risk at multiple time points.*
FDA Label Image

Figure 2 (Capecitabine Fig2)

Figure 2 (Capecitabine Fig2)
A survival curve chart comparing two treatment groups: 5-FU + Leucovorin (dashed line) and Capecitabine (solid line). The x-axis represents months since randomization, ranging from 0 to 96, and the y-axis shows survival probability from 0.0 to 1.0. A table below the graph indicates the number of patients at risk in each group at various time points.*
FDA Label Image

Figure 3 (Capecitabine Fig3)

Figure 3 (Capecitabine Fig3)
A line graph comparing the estimated probability over time (in days) for two treatment groups: 5-FU plus Leucovorin (Mayo Regimen) and Capecitabine 1250 mg/sqm twice daily intermittent. The y-axis shows estimated probability from 0 to 1, and the x-axis shows time up to 1500 days. Both groups show a decreasing probability trend over time, with data points and a marked point at 391 days.*
FDA Label Image

Figure 4 (Capecitabine Fig4)

Figure 4 (Capecitabine Fig4)
A Kaplan-Meier survival curve graph comparing two treatment groups. One group received Docetaxel 100 mg/sqm every 3 weeks (dashed line), and the other received intermittent Capecitabine 1250 mg/sqm twice daily combined with Docetaxel 75 mg/sqm every 3 weeks (solid line). The graph shows estimated probability on the vertical axis and time in days on the horizontal axis, with marked median survival times around 128 and 186 days.*
FDA Label Image

Figure 5 (Capecitabine Fig5)

Figure 5 (Capecitabine Fig5)
A Kaplan-Meier survival plot comparing estimated probability over time (days) for two treatment groups: Docetaxel 100 mg/sqm every 3 weeks (dashed line) and Capecitabine 1250 mg/sqm twice daily intermittently combined with Docetaxel 75 mg/sqm every 3 weeks (solid line). The x-axis represents time in days, and the y-axis represents estimated probability. Two vertical dashed lines at approximately 351.5 and 442 days with arrows indicate specific time points on the plot.*
FDA Label Image

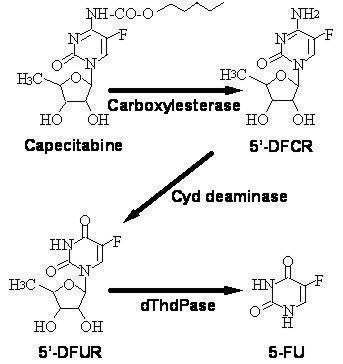
Chemical Structure (Capecitabine Met Path)

Chemical Structure (Capecitabine Met Path)
An illustration showing the metabolic conversion of Capecitabine through enzymatic steps. It depicts Capecitabine transformed into 5'-DFCR by carboxylesterase, then into 5'-DFUR by Cyd deaminase, and finally into 5-FU by dThdPase.*
FDA Label Image

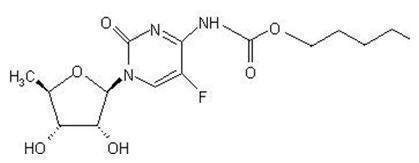
Chemical Structure (Capecitabine Str)

Chemical Structure (Capecitabine Str)
Chemical structure of capecitabine, the active ingredient in the drug CAPECITABINE. The diagram shows the molecular structure including functional groups and bonds typical for capecitabine.*

* About these descriptions: Image descriptions on this page are generated by automated AI analysis of the product label images from the manufacturer's FDA label submission (SPL). They are provided for reference only and may contain errors or omissions. Always rely on the printed label itself and the official FDA labeling, and consult a pharmacist or healthcare professional with any questions about this product.