Paclitaxel Injection, Solution
Product Images NDC 68001-516

11 FDA label images from Bluepoint Laboratories · Packaging, Regulatory Labels, and Product Appearance

Product Visual Gallery

This gallery contains 11 technical images submitted to the FDA as part of the official labeling for Paclitaxel (NDC 68001-516). Unlike standard consumer photos, these assets often include clinical data figures, molecular chemical structures, and official manufacturer packaging layouts.

As provided by Bluepoint Laboratories, these visuals offer a comprehensive scientific overview of the product's physical and chemical identity, aiding pharmacists and researchers in product verification and study.

FDA Label Image

Paclitaxel Injection, Usp 300 mg-50 mL (6 mg-ml) (Carton)

Paclitaxel Injection, Usp 300 mg-50 mL (6 mg-ml) (Carton)
Packaging label for Paclitaxel Injection, USP 300 mg/50 mL (6 mg/mL) by BluePoint Laboratories. The label indicates it is a semisynthetic, cytotoxic agent for intravenous use, with a 1 x 50 mL multiple dose vial. It includes caution for dilution prior to infusion and handling instructions.*
FDA Label Image

Paclitaxel Injection, Usp 300 mg-50 mL (6 mg-ml) (Vial)

Paclitaxel Injection, Usp 300 mg-50 mL (6 mg-ml) (Vial)
Paclitaxel Injection, USP 300 mg/50 mL (6 mg/mL) intravenous solution vial label by BluePoint Laboratories. The label details the active ingredients, handling precautions, storage conditions, and manufacturer information for this 50 mL multiple dose vial. It includes warnings about dilution and cytotoxicity and features a barcode and lot/revision details.*
FDA Label Image

Fig-1 (Figure 1)

Fig-1 (Figure 1)
A Kaplan-Meier survival curve showing the proportion surviving over years for two groups labeled 'Cc' and 'Tc.' The chart plots survival probability on the vertical axis and time in years on the horizontal axis, with survival declining over approximately 4 years. Included is a summary table with sample sizes, number of events, and hazard ratio (HR) with confidence interval for the two groups.*
FDA Label Image

Fig-2 (Figure 2)

Fig-2 (Figure 2)
A survival curve chart depicting the proportion of survival over a five-year period for two groups labeled 'Cc' and 'Tc'. The graph includes data on the number of subjects at risk each year, hazard ratio with confidence interval, and number of events for each group.*
FDA Label Image

Fig-3 (Figure 3)

Fig-3 (Figure 3)
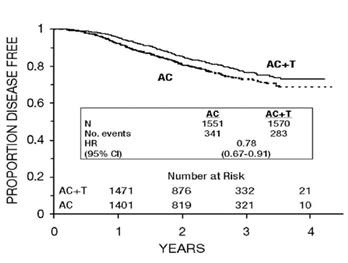
A Kaplan-Meier survival curve graph depicting the proportion of disease-free patients over time in years, comparing two groups labeled AC and AC+T. The image includes the number of participants, event counts, hazard ratio with confidence interval, and the number at risk at various time points for each group.*
FDA Label Image

Fig-4 (Figure 4)

Fig-4 (Figure 4)
A survival curve graph showing the proportion surviving over a period of 4 years for two treatment groups labeled AC and AC+T. The graph includes numerical data on sample size, number of events, hazard ratio with confidence interval, and numbers at risk over time for each group.*
FDA Label Image

Fig-5 (Figure 5)

Fig-5 (Figure 5)
A Kaplan-Meier survival curve showing the proportion of patients who remain disease-free over four years. The graph compares two treatment groups labeled AC and AC+T, with AC+T showing a higher disease-free proportion throughout the timeline. The chart includes a table displaying the number of events, hazard ratio (HR) with 95% confidence interval, and the number of patients at risk at different years for each group.*
FDA Label Image

Fig-6 (Figure 6)

Fig-6 (Figure 6)
A Kaplan-Meier curve illustrating the proportion of patients disease-free over a 4-year period comparing two treatment groups: AC and AC+T. The graph includes a table summarizing the number of patients, number of events, and hazard ratio with 95% confidence interval for each group.*
FDA Label Image

Fig-7 (Figure 7)

Fig-7 (Figure 7)
A Kaplan-Meier survival curve chart showing the proportion of disease-free patients over a period of 4 years. Two groups are compared: AC and AC+T, with the y-axis representing the proportion disease-free and the x-axis representing years. The chart includes numbers at risk and hazard ratio data in an inset table.*
FDA Label Image

Fig-8 (Figure 8)

Fig-8 (Figure 8)
A survival curve chart comparing the proportion of disease-free patients over four years between two treatment groups labeled AC and AC+T. The graph includes a risk table and hazard ratio data within the plot area, showing event counts and confidence intervals for each group.*
FDA Label Image

Structure (Structure)

Structure (Structure)
Chemical structure of Paclitaxel, the active ingredient in the intravenous injection solution by BluePoint Laboratories at 6 mg/mL strength.*

* About these descriptions: Image descriptions on this page are generated by automated AI analysis of the product label images from the manufacturer's FDA label submission (SPL). They are provided for reference only and may contain errors or omissions. Always rely on the printed label itself and the official FDA labeling, and consult a pharmacist or healthcare professional with any questions about this product.