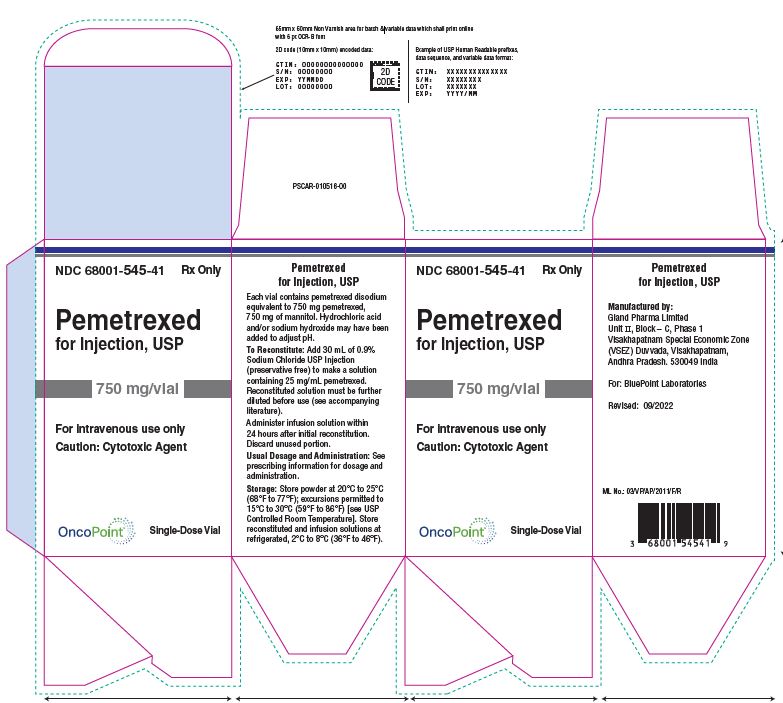
Pemetrexed For Injection 750mg Label (Image 01)

This text is a description of a drug called Pemetrexed, which is for Injection and only to be used intravenously. It comes in a single-dose vial called OncoPoint and each vial contains pemetrexed disodium equivalent to 750 mg pemetrexed, 750 mg of mannitol. It is a Cytotoxic Agent and caution should be taken while handling it. The storage temperature is between 20°C to 25°C (68 to 77°F), and the literature accompanying the drug should be consulted for the storage of reconstituted and infusion solutions. It is manufactured by lnd Phama L, Ind. for BusPont Laboratories.*