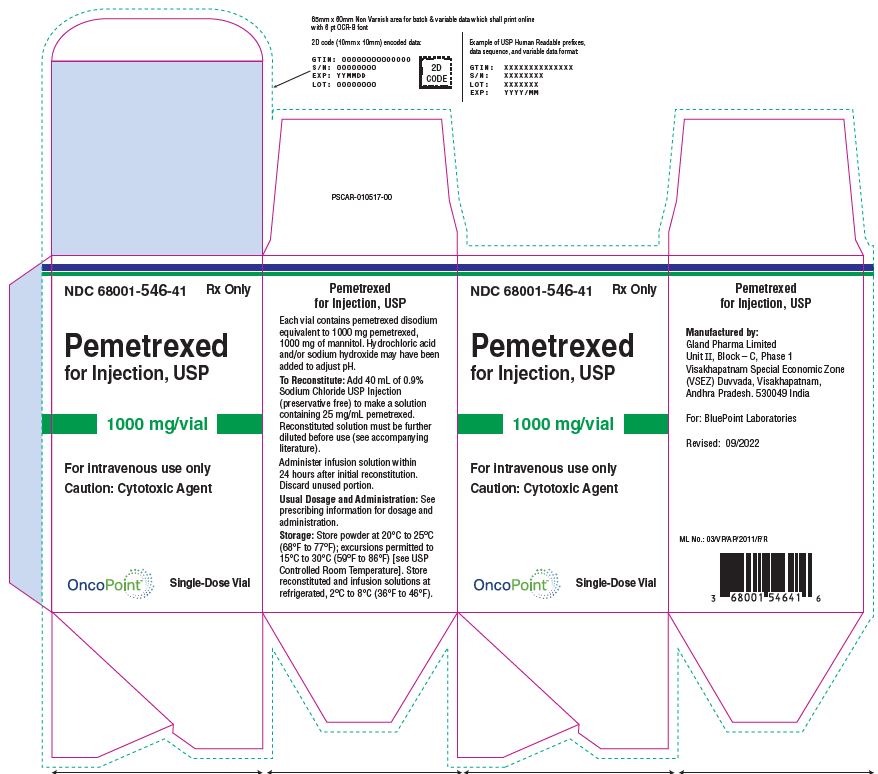
Pemetrexed For Injection 1000mg Label (Image 01)
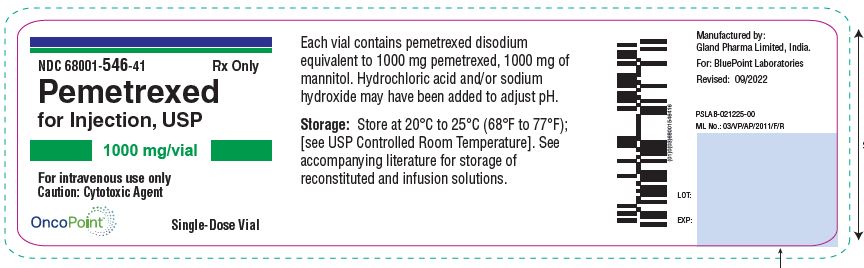
This is a description of Pemetrexed for Injection, a cytotoxic agent that should only be used via an intravenous route. Each single-dose vial contains 1000mg of pemetrexed disodium and 1000mg of manitol, as well as adjustments made with hydrochloric acid or sodium hydroxide to adjust pH. Storage should be kept between 20C to 25C, and the literature should be consulted before the drug is given. This drug is manufactured by Glnd Parma I in India and is intended for use in OncoPoint.*