Tamsulosin Hydrochloride
Product Images NDC 68071-1934

View Photos of Packaging, Regulatory Labels, and Product Appearance

Product Visual Gallery

This gallery contains 7 technical images submitted to the FDA as part of the official labeling for Tamsulosin Hydrochloride (NDC 68071-1934). Unlike standard consumer photos, these assets often include clinical data figures, molecular chemical structures, and official manufacturer packaging layouts.

As provided by Nucare Pharmaceuticals, Inc., these visuals offer a comprehensive scientific overview of the product's physical and chemical identity, aiding pharmacists and researchers in product verification and study.

FDA Label Image

68071 1934 3

68071 1934 3
Label for Tamsulosin Hydrochloride 0.4 mg capsules by NuCare Pharmaceuticals, Inc. The label indicates 30 capsules per package. Capsules are described as oblong olive green cap and light yellow body with imprint '160' on both cap and body. Product number P1849030 is noted, with warnings to keep out of reach of children and storage instructions at controlled temperature.*
FDA Label Image

Figure-1 (Tamsulosin Fig1)

Figure-1 (Tamsulosin Fig1)
A pharmacokinetic line graph showing plasma concentration (ng/mL) over time (hours) for Tamsulosin Hydrochloride under fasted and fed conditions. The graph compares plasma levels up to 36 hours, illustrating higher peak concentrations and earlier peaks in the fasted state compared to the fed state.*
FDA Label Image

Figure-2a (Tamsulosin Fig2a)

Figure-2a (Tamsulosin Fig2a)
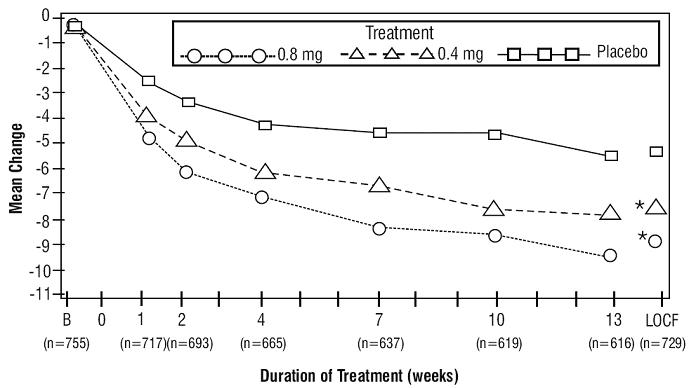
Line graph depicting mean change over treatment duration in weeks for 0.8 mg, 0.4 mg doses of Tamsulosin Hydrochloride, and placebo. The y-axis represents mean change values; the x-axis shows treatment duration at multiple time points up to 13 weeks plus LOCF data. Different symbols denote each group with a legend for clarification.*
FDA Label Image

Figure-2b (Tamsulosin Fig2b)

Figure-2b (Tamsulosin Fig2b)
A line graph depicting mean change over duration of treatment in weeks for Tamsulosin Hydrochloride dosages 0.4 mg and 0.8 mg, compared to placebo. The X-axis represents treatment duration in weeks, while the Y-axis shows mean change values. Three treatment groups are shown with distinct markers: circles for 0.8 mg, triangles for 0.4 mg, and squares for placebo. Data points decrease over time, indicating changes during the study period.*
FDA Label Image

Tamsulosin-fig3a (Tamsulosin Fig3a)

Tamsulosin-fig3a (Tamsulosin Fig3a)
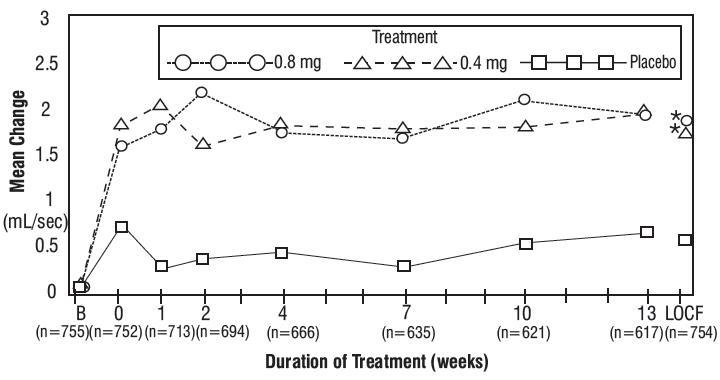
Line graph showing mean change in mL/sec over duration of treatment (weeks) for three groups: Tamsulosin Hydrochloride 0.8 mg, 0.4 mg, and placebo. The x-axis represents weeks of treatment, with sample sizes noted below. The y-axis shows mean change in urinary flow rate (mL/sec). Treatment groups are distinguished by different symbols and line styles, with changes tracked from baseline through up to 13 weeks and labeled outcome (LOCF) data points.*
FDA Label Image

Tamsulosin-fig3b (Tamsulosin Fig3b)

Tamsulosin-fig3b (Tamsulosin Fig3b)
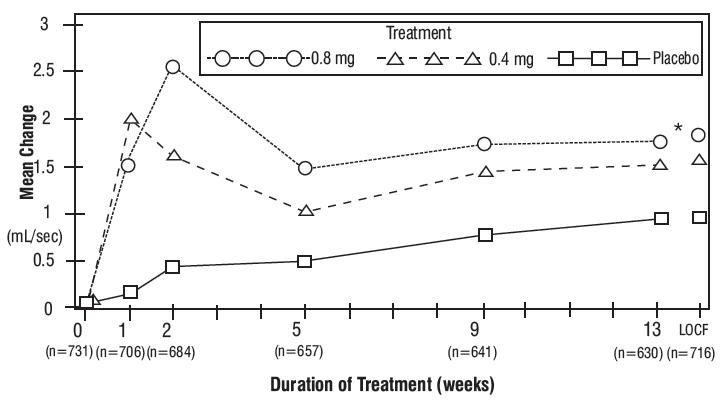
A line graph illustrating the mean change in milliliters per second (mL/sec) over treatment duration in weeks for three groups: Tamsulosin Hydrochloride 0.8 mg, 0.4 mg, and placebo. The graph shows mean change increasing most for the 0.8 mg dose, followed by 0.4 mg, with the placebo group showing the least change. Sample sizes at various time points are indicated below the x-axis.*
FDA Label Image

Chemical-structure (Tamsulosin Str)

Chemical-structure (Tamsulosin Str)
Chemical structure diagram of Tamsulosin Hydrochloride showing its molecular components and arrangement, including aromatic rings and substituents.*

* About these descriptions: Image descriptions on this page are generated by automated AI analysis of the product label images from the manufacturer's FDA label submission (SPL). They are provided for reference only and may contain errors or omissions. Always rely on the printed label itself and the official FDA labeling, and consult a pharmacist or healthcare professional with any questions about this product.