Lamotrigine
Product Images NDC 68071-2054

View Photos of Packaging, Regulatory Labels, and Product Appearance

Product Visual Gallery

This gallery contains 7 technical images submitted to the FDA as part of the official labeling for Lamotrigine (NDC 68071-2054). Unlike standard consumer photos, these assets often include clinical data figures, molecular chemical structures, and official manufacturer packaging layouts.

As provided by Nucare Pharmaceuticals,inc., these visuals offer a comprehensive scientific overview of the product's physical and chemical identity, aiding pharmacists and researchers in product verification and study.

FDA Label Image

Image (2d955155 686d 40cd 898e Df7d760247a5 740 1)

FDA Label Image

Image (2d955155 686d 40cd 898e Df7d760247a5 789 2)

Image (2d955155 686d 40cd 898e Df7d760247a5 789 2)
Lamotrigine tablets in four dosage strengths and colors: 25 mg white oval tablets engraved with 'U 111'; 100 mg white triangular tablets engraved with 'U 112'; 150 mg white triangular tablets engraved with 'U 113'; and 200 mg light blue triangular tablets engraved with 'U 114', distributed by NuCare Pharmaceuticals, Inc.*
FDA Label Image

Image (2d955155 686d 40cd 898e Df7d760247a5 789 3)

FDA Label Image

Pdp (68071 2054 9)

Pdp (68071 2054 9)
Label for Lamotrigine 25mg tablets by NuCare Pharmaceuticals, Inc. The label indicates 90 scored, white, caplet-shaped tablets with specific debossed markings. The product is prescription-only and includes storage instructions to keep at controlled temperatures between 68-77°F. Manufacturer is Unichem Laboratories Ltd., India.*
FDA Label Image

Molecular Structure (Ad7af627 Ea4b 4a78 A71e Db1255416d1e 01)

Molecular Structure (Ad7af627 Ea4b 4a78 A71e Db1255416d1e 01)
Chemical structure diagram of lamotrigine showing its molecular composition including chlorine atoms, amino groups, and a triazine ring.*
FDA Label Image

Figure 1 (Ad7af627 Ea4b 4a78 A71e Db1255416d1e 02)

Figure 1 (Ad7af627 Ea4b 4a78 A71e Db1255416d1e 02)
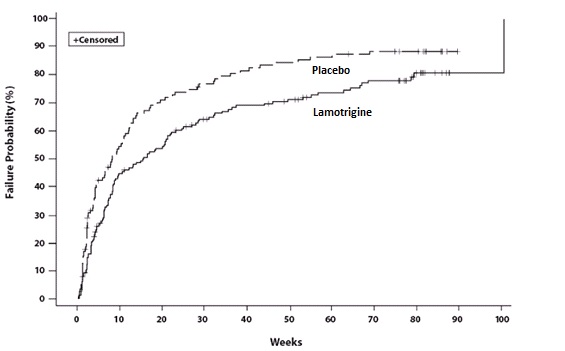
A Kaplan-Meier failure probability curve comparing Lamotrigine and placebo groups over approximately 100 weeks. The graph displays failure probability percentage on the y-axis and weeks on the x-axis, with indicators for censored data. The placebo group shows higher failure probability compared to the Lamotrigine group throughout the study period.*
FDA Label Image

Figure 2 (Ad7af627 Ea4b 4a78 A71e Db1255416d1e 03)

Figure 2 (Ad7af627 Ea4b 4a78 A71e Db1255416d1e 03)
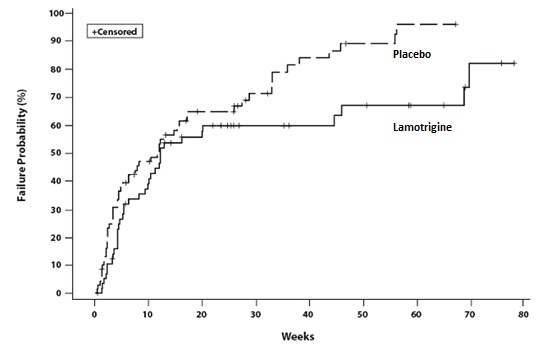
A Kaplan-Meier failure probability curve showing the comparison between Lamotrigine and Placebo over approximately 80 weeks. The y-axis represents failure probability as a percentage, while the x-axis shows time in weeks. The graph includes censorship marks and illustrates lower failure probability for Lamotrigine compared to Placebo throughout the duration.*

* About these descriptions: Image descriptions on this page are generated by automated AI analysis of the product label images from the manufacturer's FDA label submission (SPL). They are provided for reference only and may contain errors or omissions. Always rely on the printed label itself and the official FDA labeling, and consult a pharmacist or healthcare professional with any questions about this product.