Gabapentin Capsule
Product Images NDC 68071-2366

View Photos of Packaging, Regulatory Labels, and Product Appearance

Product Visual Gallery

This gallery contains 7 technical images submitted to the FDA as part of the official labeling for Gabapentin (NDC 68071-2366). Unlike standard consumer photos, these assets often include clinical data figures, molecular chemical structures, and official manufacturer packaging layouts.

As provided by Nucare Pharmaceuticals,inc., these visuals offer a comprehensive scientific overview of the product's physical and chemical identity, aiding pharmacists and researchers in product verification and study.

FDA Label Image

Pdp (68071 2366 1)

Pdp (68071 2366 1)
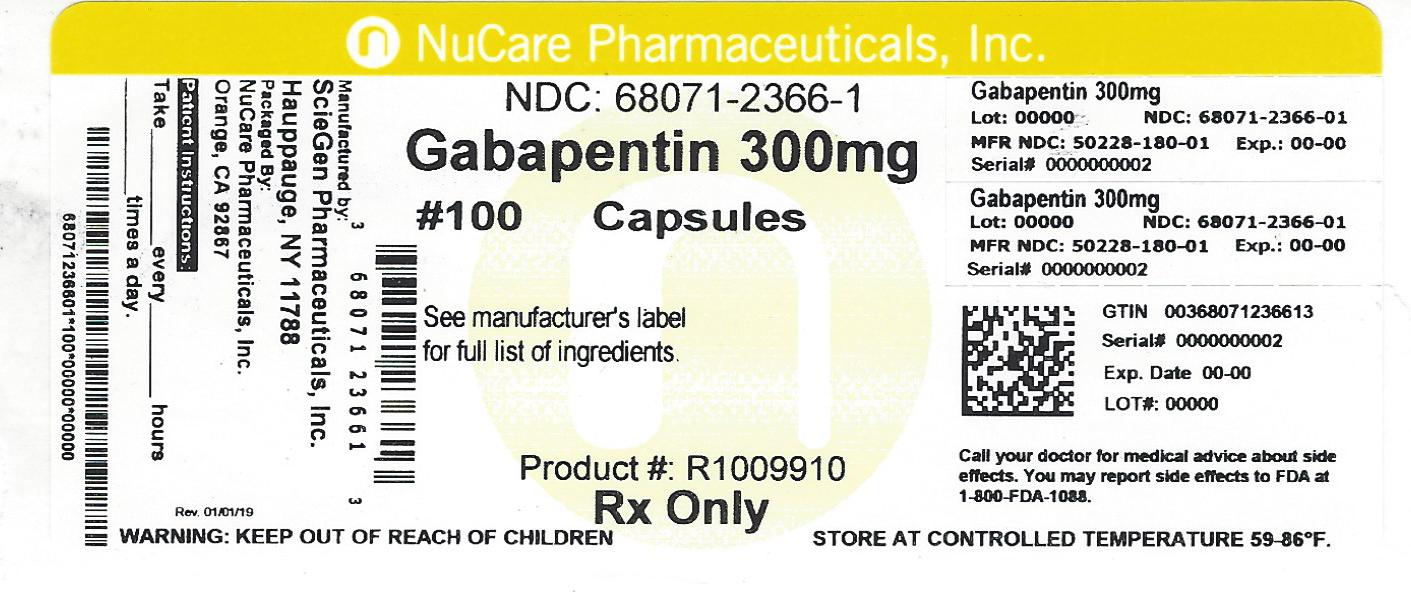
A medication called Gabapentin 300mg is being described with its lot number, NDC number, manufacturer NDC number, serial number, GTIN and an expiration date. The packaging warns to keep out of reach of children and lists the FDA number to report any side effects. Store at temperature controlled between 59-86°F.*
FDA Label Image

Figure 1 (Image 01)

Figure 1 (Image 01)
The text is describing a graph/chart displaying the mean pain score for two different treatments over a course of weeks. One treatment involves titration (dose adjustment) of a medication called "Parkod" and the other involves a fixed dose. There is also a placebo group and a group taking a medication called "Gabapentin" at a dosage of 3600 mg/day. The graph/chart shows a baseline measurement and pain scores for each treatment group over the course of several weeks.*
FDA Label Image

Figure 2 (Image 02)

Figure 2 (Image 02)
The text describes a graph showing the mean pain score of a study group over a 4-week period. The study involved testing the effectiveness of a placebo and two different doses of Gabapentin (1800 mg/day and 2400 mg/day) on pain reduction. The X-axis represents the weeks of the study, and the Y-axis represents the mean pain score. The baseline pain score was taken before the study began. The graph shows a decrease in mean pain scores for all three groups, with the group taking Gabapentin at 2400 mg/day showing the most significant reduction in pain.*
FDA Label Image

Figure 3 (Image 03)

FDA Label Image

Cockcroft And Gault Equation (Image 04)

FDA Label Image

Gabapentin Structural Formula (Image 05)

FDA Label Image

Image-09 (Image 09)

* These product label images have been analyzed using experimental machine learning. Please verify findings with the primary label text.