Gabapentin
Product Images NDC 68071-2458

View Photos of Packaging, Regulatory Labels, and Product Appearance

Product Visual Gallery

This gallery contains 7 technical images submitted to the FDA as part of the official labeling for Gabapentin (NDC 68071-2458). Unlike standard consumer photos, these assets often include clinical data figures, molecular chemical structures, and official manufacturer packaging layouts.

As provided by Nucare Pharmaceuticals,inc., these visuals offer a comprehensive scientific overview of the product's physical and chemical identity, aiding pharmacists and researchers in product verification and study.

FDA Label Image

Pdp (68071 2458 1)

Pdp (68071 2458 1)
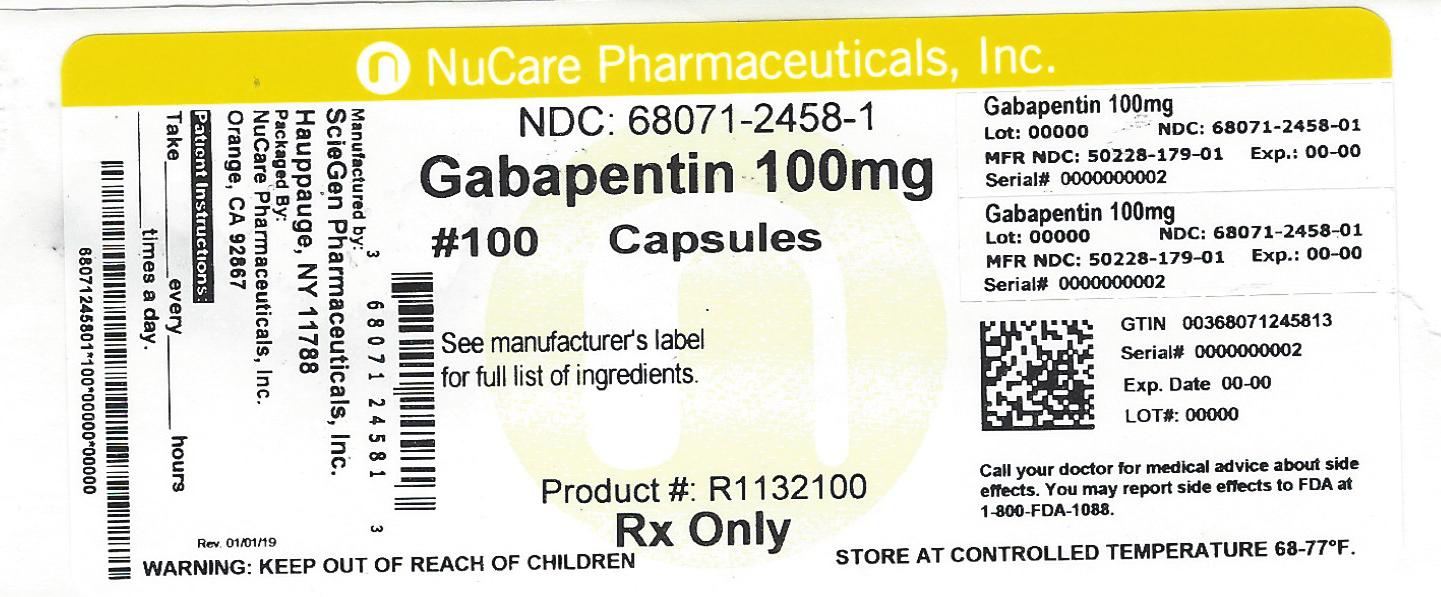
This appears to be a scan of a medication package for Gabapentin 100mg capsules. It includes the medication's NDC number, lot number, manufacturer, and expiration date. It also includes a warning to keep the medication out of reach of children and a phone number to call in case of adverse reactions.*
FDA Label Image

Figure 1 (Image 01)

Figure 1 (Image 01)
This appears to be the presentation of a pain study with different treatment groups receiving either a placebo or gabapentin at a high dose. The study measured the mean pain score starting at baseline and conducted weekly evaluations. However, it is unclear what type of pain was being evaluated and the format of the results is not clear enough to draw further conclusions.*
FDA Label Image

Figure 2 (Image 02)

Figure 2 (Image 02)
This is a graph showing the results of a study on the effect of different doses of Gabapentin on pain scores over a 4-week period. The x-axis represents the number of weeks in the study, while the y-axis represents the mean pain score reported by the participants. The study involved a placebo group and two groups of participants taking different doses of Gabapentin (1800 mg/day and 2400 mg/day). The graph shows that both doses of Gabapentin were effective in reducing pain scores compared to the placebo, with the higher dose showing slightly better results.*
FDA Label Image

Figure 3 (Image 03)

FDA Label Image

Cockcroft And Gault Equation (Image 04)

FDA Label Image

Gabapentin Structural Formula (Image 05)

FDA Label Image

Image-09 (Image 09)

* These product label images have been analyzed using experimental machine learning. Please verify findings with the primary label text.