Product Images Tamsulosin Hydrochloride

View Photos of Packaging, Labels & Appearance

Product Label Images

The following 7 images provide visual information about the product associated with Tamsulosin Hydrochloride NDC 68071-2508 by Nucare Pharmaceuticals,inc., such as packaging, labeling, and the appearance of the drug itself. This resource could be helpful for medical professionals, pharmacists, and patients seeking to verify medication information and ensure they have the correct product.

PDP - 68071 2508 1

PDP - 68071 2508 1

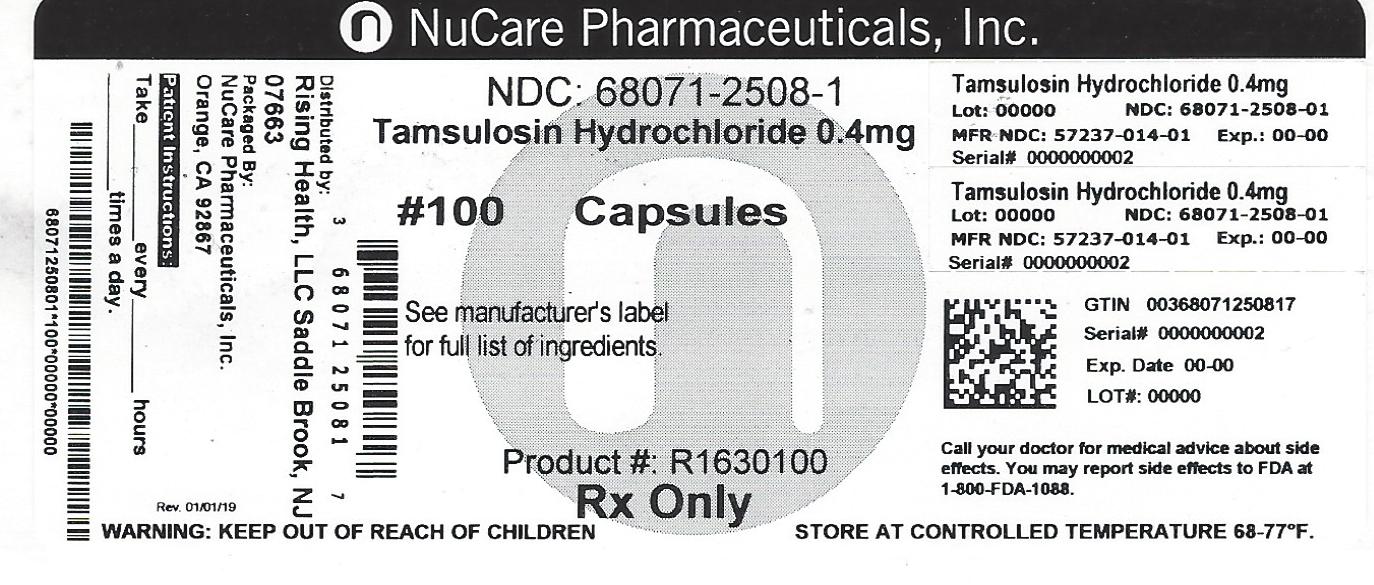
This is a product label of Tamsulosin Hydrochloride 0.4 mg, a medication used for the treatment of an enlarged prostate in men. It comes in the form of 100 capsules per bottle from the manufacturer Care Pharmaceuticals, Inc. The label contains information such as the lot number, product number, expiration date, and serial number, to ensure safety during the distribution process. Additionally, there are warnings to keep the medication out of reach of children and to store it at a controlled temperature.*

Figure 1 Mean Plasma Tamsulosin Hydrochloride Concentrations Following Single-Dose Administration of Tamsulosin Hydrochloride Capsules 0.4 mg Under Fasted and Fed Conditions (n=8) - tamsulosin fig1

Figure 1 Mean Plasma Tamsulosin Hydrochloride Concentrations Following Single-Dose Administration of Tamsulosin Hydrochloride Capsules 0.4 mg Under Fasted and Fed Conditions (n=8) - tamsulosin fig1

Figure 2A Mean Change from Baseline in Total AUA Symptom Score (0 to 35) Study 1 - tamsulosin fig2

Figure 2A	Mean Change from Baseline in Total AUA Symptom Score (0 to 35) Study 1 - tamsulosin fig2

This is a figure showing the mean change from baseline in Total AUA Symptom Score (0 to 35) for Study 1. The x-axis represents the duration of treatment in weeks, and the y-axis represents the mean change. The figure compares the treatment with -OO-0-08mg_~A= A -A04my_ O30 to placebo. There are different sample sizes for each duration of treatment, represented by n values.*

Figure 2B Mean Change from Baseline in Total AUA Symptom Score (0 to 35) Study 2 - tamsulosin fig3

Figure 2B	Mean Change from Baseline in Total AUA Symptom Score (0 to 35) Study 2 - tamsulosin fig3

This text appears to be a graph showing the Mean Change from Baseline in Total American Urological Association (AUA) Symptom Score for a study with three different treatments - O=0O—0-08mg, LNt 0.4mg and Placebo. The graph shows the duration of treatment in weeks and the number of participants in each treatment group. No further information is available.*

Figure 3A Mean Increase in Peak Urine Flow Rate (mL/Sec) Study 1 - tamsulosin fig4

Figure 3A Mean Increase in Peak Urine Flow Rate (mL/Sec) Study 1 - tamsulosin fig4

This is a figure showing the mean increase in peak urine flow rate in L/sec in Study 1. The treatment group is divided into three categories: 0.08mg, 2x0.4mg, and placebo. The mean change in mL/sec is also shown on the graph along with the duration of treatment in weeks. Note: this figure does not include any insightful information without the appropriate context.*

Figure 3B Mean Increase in Peak Urine Flow Rate (mL/Sec) Study 2 - tamsulosin fig5

Figure 3B Mean Increase in Peak Urine Flow Rate (mL/Sec) Study 2 - tamsulosin fig5

Chemical Structure - tamsulosin str

Chemical Structure - tamsulosin str

* The product label images have been analyzed using a combination of traditional computing and machine learning techniques. It should be noted that the descriptions provided may not be entirely accurate as they are experimental in nature. Use the information in this page at your own discretion and risk.