Tadalafil Tablet
Product Images NDC 68071-2554

View Photos of Packaging, Regulatory Labels, and Product Appearance

Product Visual Gallery

This gallery contains 10 technical images submitted to the FDA as part of the official labeling for Tadalafil (NDC 68071-2554). Unlike standard consumer photos, these assets often include clinical data figures, molecular chemical structures, and official manufacturer packaging layouts.

As provided by Nucare Pharmaceuticals,inc., these visuals offer a comprehensive scientific overview of the product's physical and chemical identity, aiding pharmacists and researchers in product verification and study.

FDA Label Image

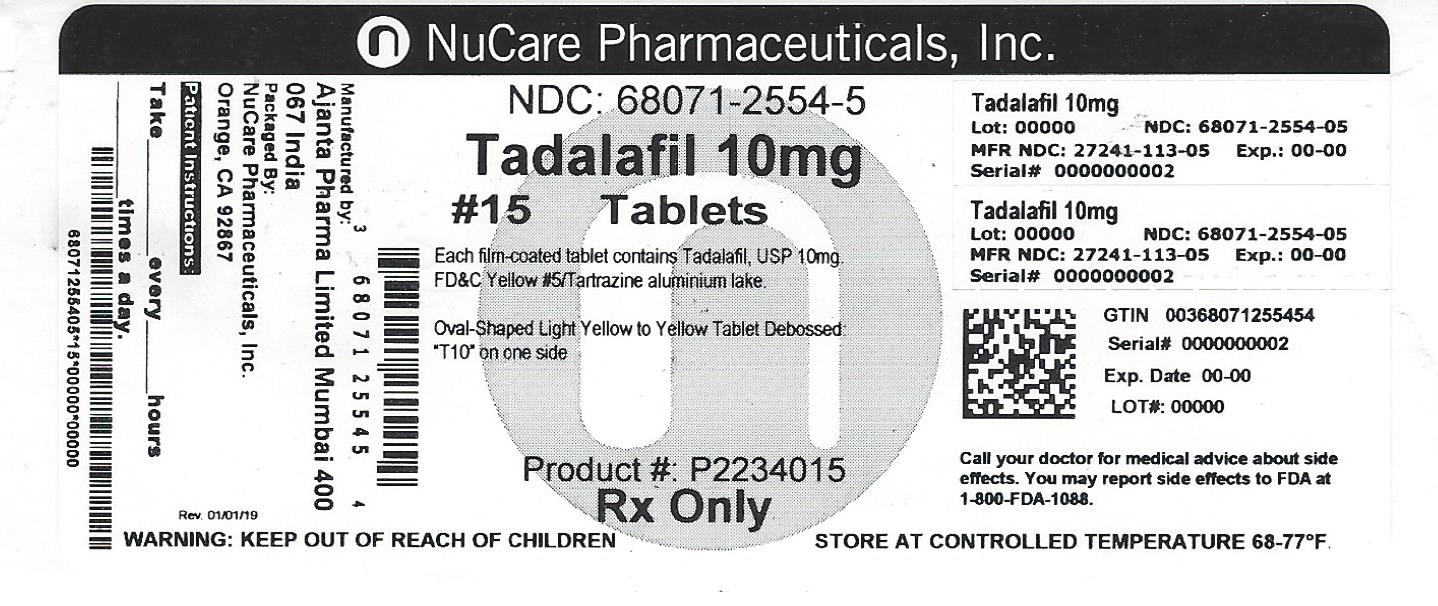
Pdp (68071 2554 5)

Pdp (68071 2554 5)
Tadalafil 10 mg film-coated tablet label by NuCare Pharmaceuticals, Inc. The label indicates a package of 15 tablets, oval-shaped light yellow tablets debossed with 'T10'. Contains FD&C Yellow #5/Tartrazine aluminum lake. Includes NDC 68071-2554-5 and storage instructions for controlled temperature (68-77°F). This is a prescription drug with warnings to keep out of reach of children.*
FDA Label Image

Figure8 (Tadalafil Fig8)

Figure8 (Tadalafil Fig8)
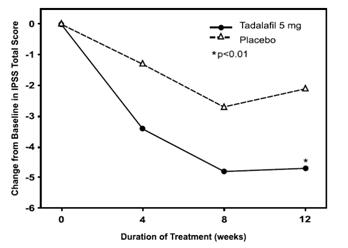
A line graph comparing change from baseline in IPSS total score over 12 weeks of treatment between Tadalafil 5 mg and placebo groups. The y-axis shows score change, and the x-axis shows treatment duration in weeks. The Tadalafil group shows a greater decrease in score, statistically significant at week 12 (p<0.01).*
FDA Label Image

Figure1 (Tadalafil Figure1)

Figure1 (Tadalafil Figure1)
A set of four line graphs showing changes in blood pressure over time. The graphs represent differences in systolic and diastolic blood pressure measurements in standing and supine positions, comparing tadalafil to placebo over a period of 0 to 96 hours.*
FDA Label Image

Figure2 (Tadalafil Figure2)

Figure2 (Tadalafil Figure2)
Two line graphs depicting the effects on systolic blood pressure (mmHg) over 24 hours post-dose. The top graph shows standing systolic blood pressure changes, and the bottom shows supine systolic blood pressure changes. Data compare Tadalafil 20 mg with doxazosin 8 mg versus placebo with doxazosin 8 mg.*
FDA Label Image

Figure3 (Tadalafil Figure3)

Figure3 (Tadalafil Figure3)
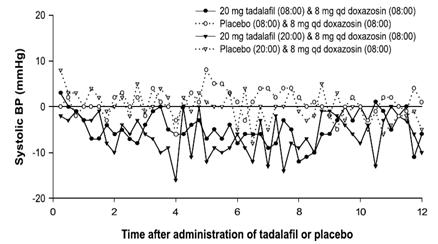
A line graph showing changes in systolic blood pressure (mmHg) over a 12-hour period after administration of tadalafil or placebo at two dosing times (08:00 and 20:00), each combined with 8 mg daily doxazosin. Different line styles represent the four treatment groups, illustrating blood pressure trends post-dose.*
FDA Label Image

Figure4 (Tadalafil Figure4)

Figure4 (Tadalafil Figure4)
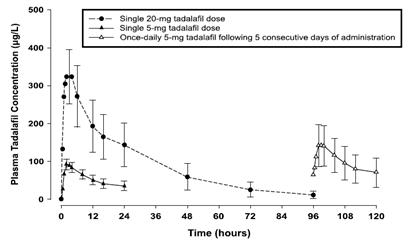
A pharmacokinetic curve showing plasma tadalafil concentration (µg/L) over time (hours) for three dosing regimens: a single 20 mg dose, a single 5 mg dose, and a once-daily 5 mg dose following 5 consecutive days of administration. The graph displays concentration decline and variability with error bars.*
FDA Label Image

Figure5 (Tadalafil Figure5)

Figure5 (Tadalafil Figure5)
A line graph comparing the change from baseline in I-PSS total score over 12 weeks of treatment between Tadalafil 5 mg and placebo groups. The x-axis shows duration of treatment in weeks, and the y-axis shows score change. The Tadalafil group shows a greater decrease in score compared to placebo, with a noted statistical significance at p<0.01.*
FDA Label Image

Figure6 (Tadalafil Figure6)

Figure6 (Tadalafil Figure6)
A line graph comparing the change from baseline in IPSS total score over a 12-week treatment duration between Tadalafil 5 mg and placebo groups. The graph shows Tadalafil 5 mg consistently reducing the IPSS score more than placebo, with statistical significance indicated at certain points.*
FDA Label Image

Figure7 (Tadalafil Figure7)

Figure7 (Tadalafil Figure7)
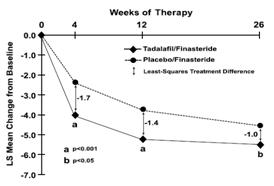
A line graph depicting the least-squares mean change from baseline over 26 weeks of therapy comparing Tadalafil/Finasteride and Placebo/Finasteride. The x-axis represents weeks of therapy (0, 4, 12, 26), and the y-axis shows the least-squares mean change from baseline with negative values. Data points indicate a greater improvement with Tadalafil/Finasteride compared to Placebo/Finasteride, with statistical significance noted at several time points.*
FDA Label Image

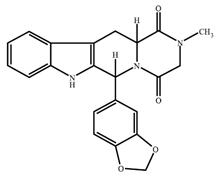
Structure (Tadalafil Structure)

Structure (Tadalafil Structure)
Chemical structure of tadalafil, showing its molecular framework with distinctive fused rings and functional groups characteristic of this active pharmaceutical ingredient.*

* About these descriptions: Image descriptions on this page are generated by automated AI analysis of the product label images from the manufacturer's FDA label submission (SPL). They are provided for reference only and may contain errors or omissions. Always rely on the printed label itself and the official FDA labeling, and consult a pharmacist or healthcare professional with any questions about this product.