Aripiprazole
Product Images NDC 68071-2676

View Photos of Packaging, Regulatory Labels, and Product Appearance

Product Visual Gallery

This gallery contains 10 technical images submitted to the FDA as part of the official labeling for Aripiprazole (NDC 68071-2676). Unlike standard consumer photos, these assets often include clinical data figures, molecular chemical structures, and official manufacturer packaging layouts.

As provided by Nucare Pharmaceuticals,inc., these visuals offer a comprehensive scientific overview of the product's physical and chemical identity, aiding pharmacists and researchers in product verification and study.

FDA Label Image

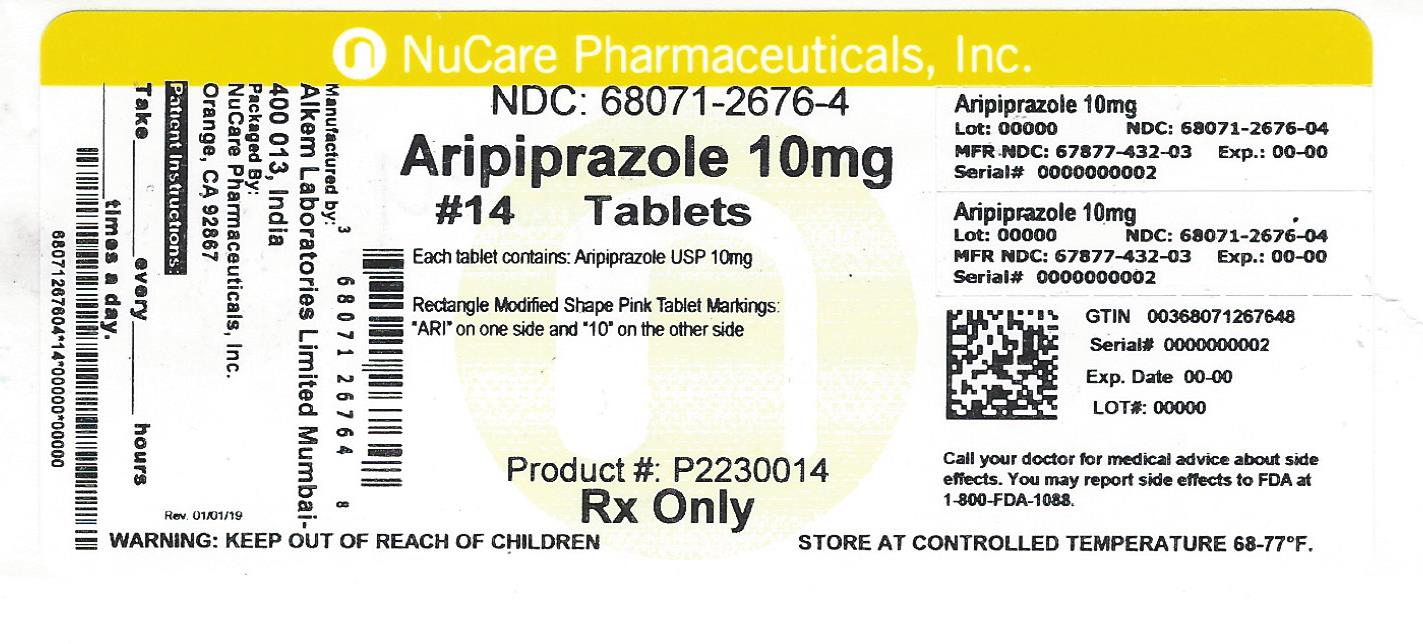
Pdp (68071 2676 4)

Pdp (68071 2676 4)
Aripiprazole 10mg tablets packaging label from NuCare Pharmaceuticals, Inc., containing 14 tablets. The label includes the NDC 68071-2676-4 and states each tablet contains Aripiprazole USP 10mg. The tablets are described as rectangle modified shape pink tablets with 'ARI' on one side and '10' on the other. The label also includes storage instructions and warnings.*
FDA Label Image

Aripiprazole-fig-16.jpg (Aripiprazole Fig 16)

Aripiprazole-fig-16.jpg (Aripiprazole Fig 16)
A Kaplan-Meier survival curve chart comparing the proportion of subjects with relapse over time (days from randomization) between Aripiprazole and placebo groups. The x-axis shows days from randomization, while the y-axis shows the proportion with relapse. The chart includes numbers of subjects at risk at various time points for both groups.*
FDA Label Image

Aripiprazole-fig-17 (Aripiprazole Fig 17)

Aripiprazole-fig-17 (Aripiprazole Fig 17)
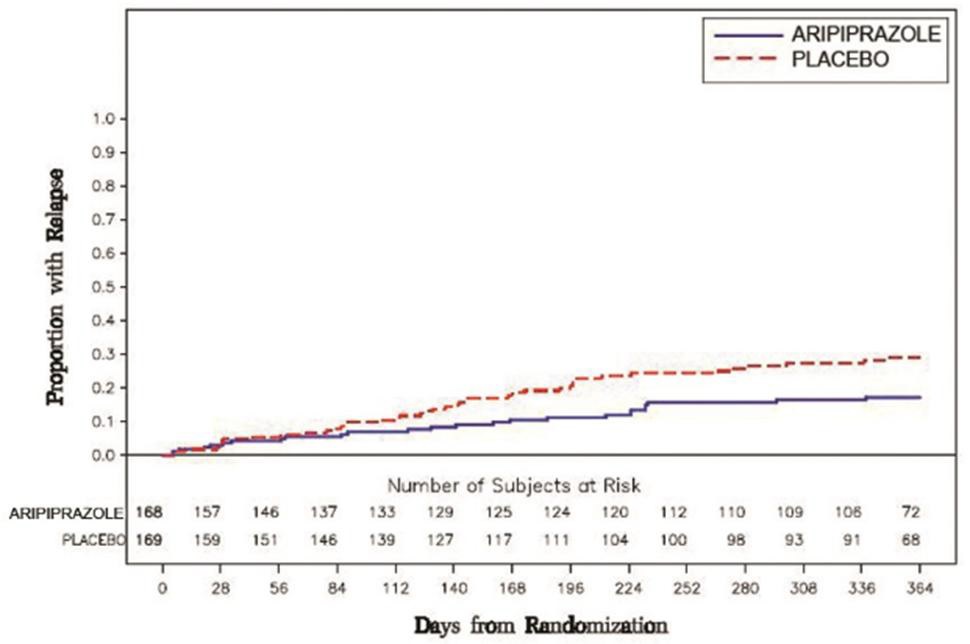
A Kaplan-Meier plot comparing the proportion of subjects with relapse over 364 days from randomization between two groups: Aripiprazole and Placebo. The x-axis shows days from randomization, and the y-axis shows the proportion with relapse. The graph includes numbers of subjects at risk at various time points for each group.*
FDA Label Image

Effects Of Other Drugs On Dehydro-aripiprazole (Aripiprazole Fig10)

Effects Of Other Drugs On Dehydro-aripiprazole (Aripiprazole Fig10)
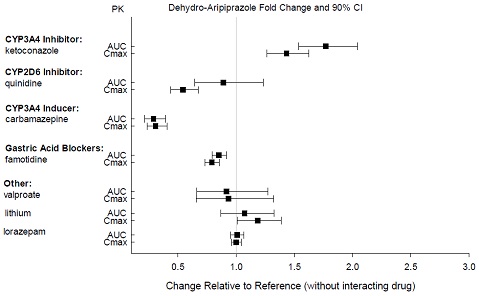
A pharmacokinetic chart titled 'Dehydro-Aripiprazole Fold Change and 90% CI' illustrating the fold change in AUC and Cmax parameters relative to a reference without interacting drugs. The chart compares the effects of various inhibitors and inducers including ketoconazole, quinidine, carbamazepine, famotidine, valproate, lithium, and lorazepam, presented as points with confidence intervals along a horizontal axis measuring change ratios from 0.5 to 3.0.*
FDA Label Image

Effects Of Aripiprazole On Pharmacokinetics Of Other Drugs (Aripiprazole Fig11)

Effects Of Aripiprazole On Pharmacokinetics Of Other Drugs (Aripiprazole Fig11)
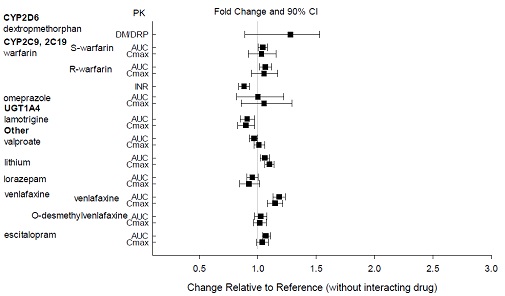
A chart showing fold changes and 90% confidence intervals for pharmacokinetic parameters (AUC and Cmax) of various drugs compared to a reference without interacting drug. Drugs listed include dextromethorphan, warfarin (S- and R-), omeprazole, lamotrigine, valproate, lithium, lorazepam, venlafaxine (including O-desmethylvenlafaxine), and escitalopram, with data points indicating relative changes in drug exposure.*
FDA Label Image

Effects Of Intrinsic Factors On Aripiprazole (Aripiprazole Fig12)

Effects Of Intrinsic Factors On Aripiprazole (Aripiprazole Fig12)
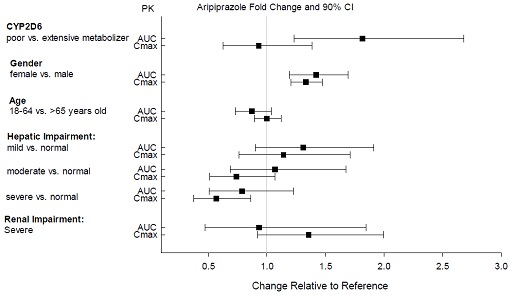
A pharmacokinetic chart titled 'Aripiprazole Fold Change and 90% CI' displaying changes in AUC and Cmax relative to reference across categories: CYP2D6 metabolism status, gender, age groups, hepatic impairment levels, and severe renal impairment. The chart uses horizontal error bars to show fold changes with confidence intervals.*
FDA Label Image

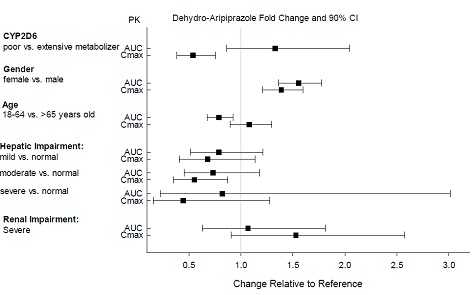
Effects Of Intrinsic Factors On Dehydro-aripiprazole (Aripiprazole Fig13)

Effects Of Intrinsic Factors On Dehydro-aripiprazole (Aripiprazole Fig13)
A forest plot chart showing fold changes and 90% confidence intervals for dehydro-aripiprazole pharmacokinetics (AUC and Cmax) relative to reference, across variables such as CYP2D6 metabolizer status, gender, age, hepatic impairment severity, and severe renal impairment.*
FDA Label Image

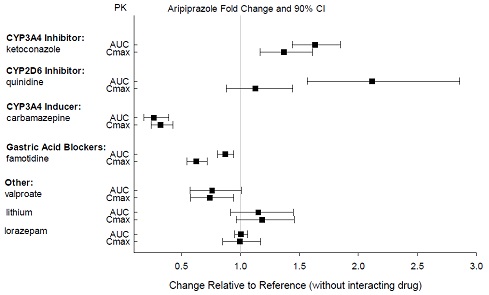
Effects Of Other Drugs On Aripiprazole (Aripiprazole Fig9)

Effects Of Other Drugs On Aripiprazole (Aripiprazole Fig9)
A pharmacokinetic chart titled "Aripiprazole Fold Change and 90% CI" showing changes in AUC and Cmax relative to reference (without interacting drug) for various inhibitors and blockers. It includes CYP3A4 inhibitors like ketoconazole, CYP2D6 inhibitors such as quinidine, CYP3A4 inducers like carbamazepine, gastric acid blockers such as famotidine, and other drugs including valproate, lithium, and lorazepam. Each category plots fold change values with 90% confidence intervals on a horizontal scale from 0 to 3.*
FDA Label Image

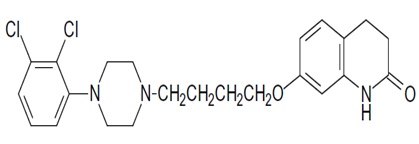
Aripiprazole Structure (Aripiprazole Fig8)

Aripiprazole Structure (Aripiprazole Fig8)
Chemical structure of Aripiprazole, showing its molecular framework with distinct rings, nitrogen atoms, chlorine atoms, and an oxygen-containing functional group, consistent with the active ingredient structure for the product labeled by NuCare Pharmaceuticals, Inc.*
FDA Label Image

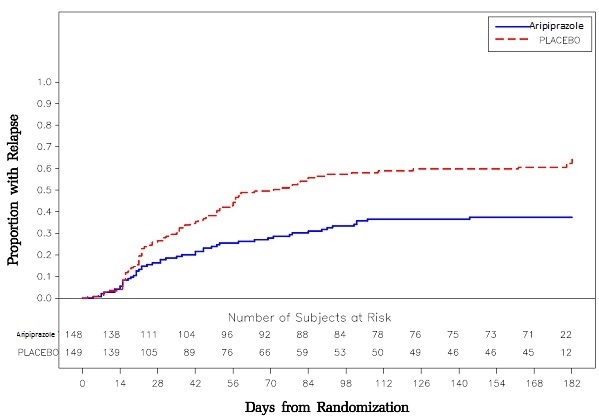
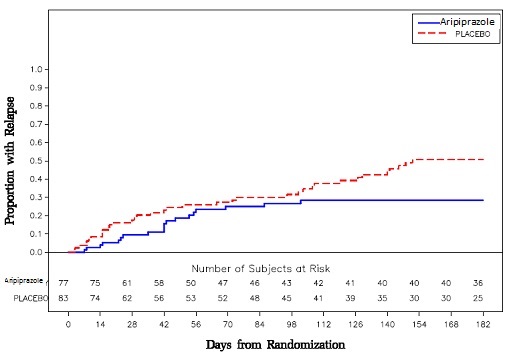
Aripiprazole-graph (Aripiprazole Graph)

Aripiprazole-graph (Aripiprazole Graph)
A Kaplan-Meier curve chart comparing the proportion of subjects with relapse over days from randomization between Aripiprazole and placebo groups. The graph shows two lines: a solid blue line for Aripiprazole and a dashed red line for placebo, with the number of subjects at risk listed below the x-axis at various time points up to 182 days.*

* About these descriptions: Image descriptions on this page are generated by automated AI analysis of the product label images from the manufacturer's FDA label submission (SPL). They are provided for reference only and may contain errors or omissions. Always rely on the printed label itself and the official FDA labeling, and consult a pharmacist or healthcare professional with any questions about this product.