Tramadol Hydrochloride
Product Images NDC 68071-2732

View Photos of Packaging, Regulatory Labels, and Product Appearance

Product Visual Gallery

This gallery contains 6 technical images submitted to the FDA as part of the official labeling for Tramadol Hydrochloride (NDC 68071-2732). Unlike standard consumer photos, these assets often include clinical data figures, molecular chemical structures, and official manufacturer packaging layouts.

As provided by Nucare Pharmaceuticals,inc., these visuals offer a comprehensive scientific overview of the product's physical and chemical identity, aiding pharmacists and researchers in product verification and study.

FDA Label Image

Pdp (68071 2732 3)

Pdp (68071 2732 3)
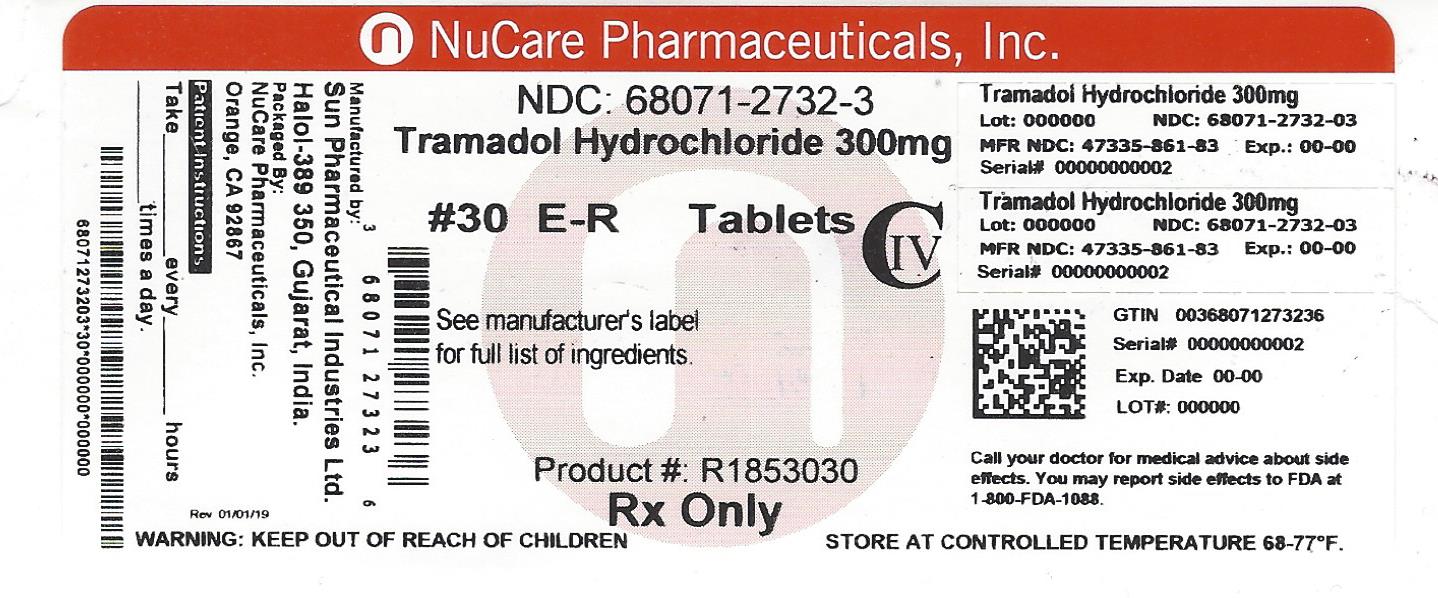
Label for TRAMADOL HYDROCHLORIDE 300 mg extended-release tablets by NuCare Pharmaceuticals, Inc. The label states a package quantity of 30 tablets, with the product number R1853030. It includes manufacturer details for Sun Pharmaceutical Industries Ltd., Hallol-389 350, Gujarat, India. The label features regulatory information, storage instructions at 68-77°F, and warnings to keep out of reach of children. It also shows lot and expiration placeholders, barcodes, and legal use restriction as Rx only.*
FDA Label Image

Tramadol-figure1 (Tramadol Figure1)

Tramadol-figure1 (Tramadol Figure1)
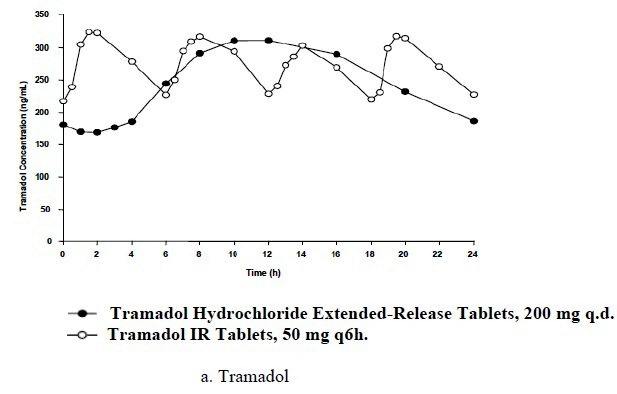
A line graph showing plasma concentration of Tramadol over 24 hours comparing two formulations: Tramadol Hydrochloride Extended-Release Tablets 200 mg once daily and Tramadol Immediate Release (IR) Tablets 50 mg every 6 hours. The y-axis represents Tramadol concentration in ng/mL, and the x-axis shows time in hours. Concentration patterns differ between formulations over time.*
FDA Label Image

Tramadol-figure2 (Tramadol Figure2)

Tramadol-figure2 (Tramadol Figure2)
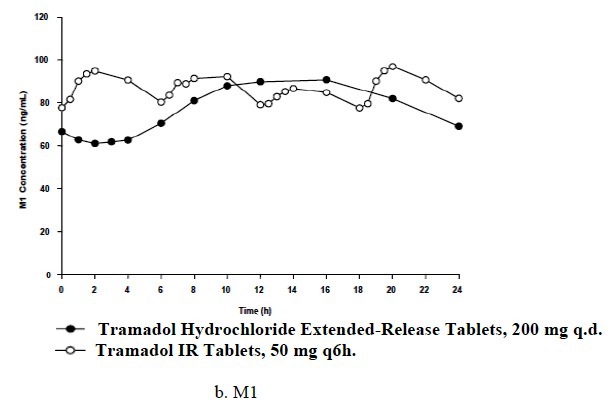
A line graph comparing M1 concentration (ng/mL) over 24 hours for Tramadol Hydrochloride Extended-Release Tablets, 200 mg q.d., and Tramadol IR Tablets, 50 mg q6h. The x-axis represents time in hours, and the y-axis represents M1 concentration. The graph includes two data lines with respective legends.*
FDA Label Image

Tramadol-figure3 (Tramadol Figure3)

Tramadol-figure3 (Tramadol Figure3)
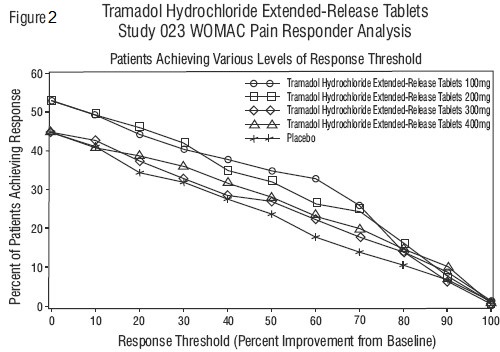
Line graph titled 'Tramadol Hydrochloride Extended-Release Tablets Study 023 WOMAC Pain Responder Analysis' showing the percent of patients achieving various levels of response threshold, plotted against response threshold percentages (0 to 100%). The graph compares five groups: Tramadol Hydrochloride Extended-Release Tablets at 100 mg, 200 mg, 300 mg, 400 mg, and Placebo, illustrating percent of patients achieving response decreasing as response threshold increases.*
FDA Label Image

Tramadol-figure4 (Tramadol Figure4)

Tramadol-figure4 (Tramadol Figure4)
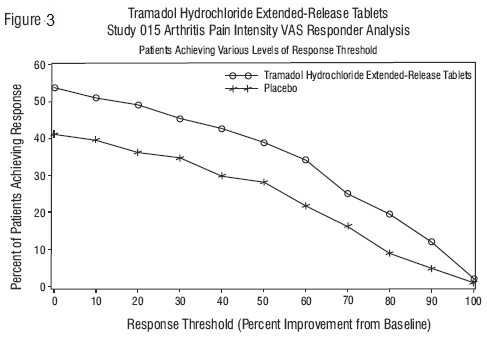
A line graph titled "Tramadol Hydrochloride Extended-Release Tablets Study 015 Arthritis Pain Intensity VAS Responder Analysis" comparing the percentage of patients achieving response at various response thresholds. The x-axis shows response threshold as percent improvement from baseline, and the y-axis shows percent of patients achieving response. Two lines are displayed: one for Tramadol Hydrochloride Extended-Release Tablets and one for placebo, illustrating higher patient response rates for the active treatment across thresholds.*
FDA Label Image

Tramadol-structure (Tramadol Structure)

Tramadol-structure (Tramadol Structure)
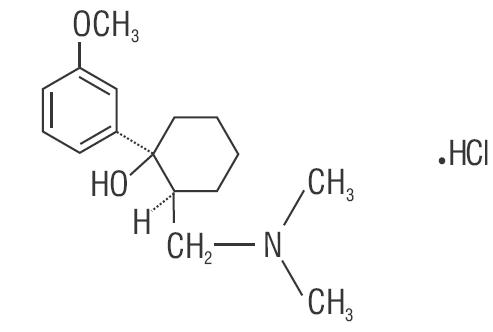
Chemical structure diagram of tramadol hydrochloride showing the molecular arrangement of atoms and bonds including a methoxyphenyl group, cyclohexane ring, and dimethylamino group with associated hydrochloride (HCl).*

* About these descriptions: Image descriptions on this page are generated by automated AI analysis of the product label images from the manufacturer's FDA label submission (SPL). They are provided for reference only and may contain errors or omissions. Always rely on the printed label itself and the official FDA labeling, and consult a pharmacist or healthcare professional with any questions about this product.