Product Images Losartan Potassium

View Photos of Packaging, Labels & Appearance

Product Label Images

The following 6 images provide visual information about the product associated with Losartan Potassium NDC 68071-2786 by Nucare Pharmaceuticals,inc., such as packaging, labeling, and the appearance of the drug itself. This resource could be helpful for medical professionals, pharmacists, and patients seeking to verify medication information and ensure they have the correct product.

pdp - 68071 2786 1

pdp - 68071 2786 1

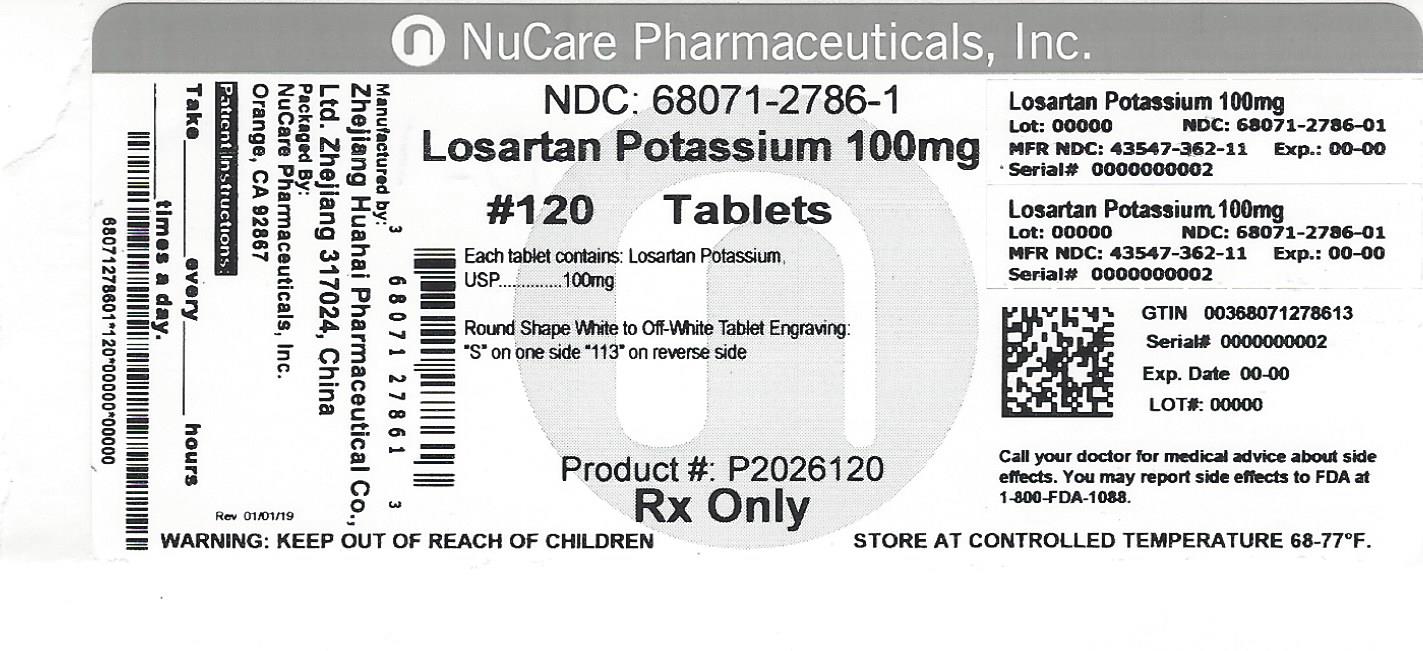
NuCare Pharmaceuticals, Inc. Losartan Potassium 100mg tablets are a prescription drug used to treat high blood pressure and reduce the risk of stroke in patients with an enlarged heart. The tablets are white to off-white, round in shape, and engraved with "S" on one side and "113" on the other. The tablets are packaged in a bottle containing 120 tablets, with lot number 00000, and an expiration date of 00-00. Patients should keep the drug out of reach of children and store it at a controlled temperature of 68-77°F. In case of any side effects, patients are advised to contact their doctor or call 1-800-FDA-1088.*

Chemical Structure - spl image1 structure1

Chemical Structure - spl image1 structure1

Figure 1 - spl image2 figure1

Figure 1 - spl image2 figure1

The text seems to be a comparison of two drugs, Atenolol and Losartan Potassium, in treating a particular condition. The percentage of patients who achieved the primary endpoint is mentioned along with an adjusted risk reduction percentage and p-value. The numbers 0 to 66 represent study months.*

Figure 2 - spl image3 figure2

Figure 2 - spl image3 figure2

This is a clinical study comparison between two medications - Atenolol and Losartan Potassium. The study shows that Losartan Potassium has an adjusted risk reduction rate of 25% with a p-value of 0.001 compared to Atenolol. The chart depicts the percentage of patients with fatal/non-fatal stroke at different study months from 6 to 66.*

Figure 3 - spl image4 figure3

Figure 3 - spl image4 figure3

Figure 4 - spl image5 figure4

Figure 4 - spl image5 figure4

This is a graph showing the results of a clinical trial comparing Losartan Potassium to Placebo over a 48 month period. The percentage of patients with an event is shown on the y-axis, with values of 60%, 40%, and 20% marked. The x-axis shows the time in months. The trial found a risk reduction of 16.1% with a p-value of 0.022.*

* The product label images have been analyzed using a combination of traditional computing and machine learning techniques. It should be noted that the descriptions provided may not be entirely accurate as they are experimental in nature. Use the information in this page at your own discretion and risk.