Anastrozole Tablet
Product Images NDC 68071-2791

View Photos of Packaging, Regulatory Labels, and Product Appearance

Product Visual Gallery

This gallery contains 8 technical images submitted to the FDA as part of the official labeling for Anastrozole (NDC 68071-2791). Unlike standard consumer photos, these assets often include clinical data figures, molecular chemical structures, and official manufacturer packaging layouts.

As provided by Nucare Pharmaceuticals,inc., these visuals offer a comprehensive scientific overview of the product's physical and chemical identity, aiding pharmacists and researchers in product verification and study.

FDA Label Image

Pdp (68071 2791 5)

Pdp (68071 2791 5)
The image shows a drug label for Anastrozole 1 mg tablets by NuCare Pharmaceuticals, Inc. The label indicates a package of 15 tablets. Tablets are round biconvex, white to off-white, debossed with "AN" on one side. The product is prescription only, with NDC 68071-2791-5, and manufactured by Intas Pharmaceuticals Limited in India.*
FDA Label Image

Figure 1 (Anastrozole Fig1)

Figure 1 (Anastrozole Fig1)
A line graph depicting disease-free survival over 96 months comparing anastrozole and tamoxifen treatments. The y-axis shows the proportion alive and disease-free from 0.0 to 1.0. The x-axis shows disease-free survival in months, from 0 to 96. The graph includes two lines: a solid line for tamoxifen and a dashed line for anastrozole, illustrating survival trends over time. Below the graph, a table shows the number of patients at risk for both treatments at defined time points.*
FDA Label Image

Figure 2 (Anastrozole Fig2)

Figure 2 (Anastrozole Fig2)
A line graph comparing disease-free survival over 80 months between two randomized treatments: anastrozole and tamoxifen. The y-axis represents the proportion alive and disease-free, ranging from 0.0 to 1.0, while the x-axis shows disease-free survival in months. The graph includes a table showing the number of patients at risk for each treatment at various time points.*
FDA Label Image

Figure 3 (Anastrozole Fig3)

Figure 3 (Anastrozole Fig3)
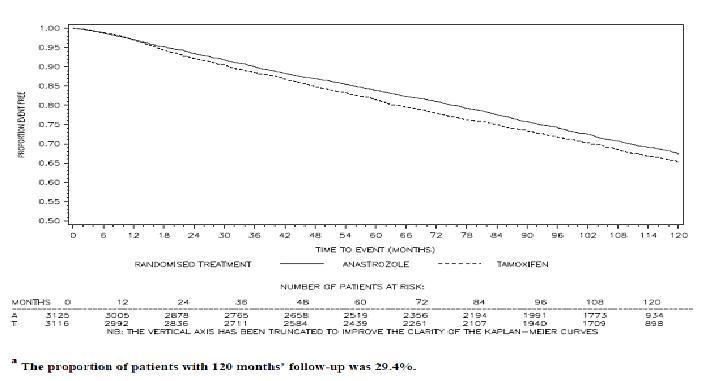
A line graph comparing the proportion of patients remaining event-free over time (months) up to 120 months for two treatments: Anastrozole (solid line) and Tamoxifen (dashed line). The x-axis represents time to event in months, and the y-axis shows the proportion event-free. Patient risk numbers are listed at intervals below the x-axis. The vertical axis is truncated for clarity of the Kaplan-Meier curves.*
FDA Label Image

Figure 4 (Anastrozole Fig4)

Figure 4 (Anastrozole Fig4)
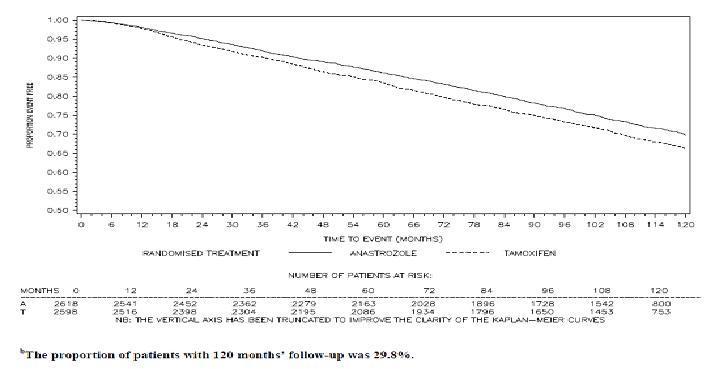
A Kaplan-Meier survival curve graph showing the proportion of patients event-free over time in months, comparing Anastrozole and Tamoxifen treatments in a randomized trial. The x-axis represents time to event up to 120 months; the y-axis shows the proportion event free from 0.5 to 1.0. Patient risk numbers at various months are tabulated below the graph.*
FDA Label Image

Figure 5 (Anastrozole Fig5)

Figure 5 (Anastrozole Fig5)
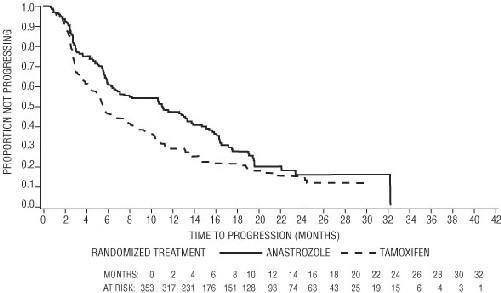
A Kaplan-Meier curve plot showing proportion not progressing over time in months, comparing randomized treatments of Anastrozole and Tamoxifen. The x-axis represents time to progression in months, and the y-axis shows the proportion not progressing. The plot includes distinct lines for Anastrozole and Tamoxifen treatments, with accompanying patient risk numbers below the time axis.*
FDA Label Image

Figure 6 (Anastrozole Fig6)

Figure 6 (Anastrozole Fig6)
A line graph comparing the proportion of patients not progressing over time (in months) for two treatments: Anastrozole and Tamoxifen. The x-axis represents time in months up to 42 months, and the y-axis represents the proportion not progressed, ranging from 0 to 1. Two lines indicate progression rates for each treatment group.*
FDA Label Image

Chemical Structure For Anastrozole (Anastrozole Str)

Chemical Structure For Anastrozole (Anastrozole Str)
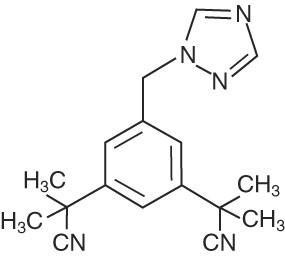
Chemical structure of Anastrozole, illustrating the arrangement and bonding of atoms within the molecule as shown in the image.*

* About these descriptions: Image descriptions on this page are generated by automated AI analysis of the product label images from the manufacturer's FDA label submission (SPL). They are provided for reference only and may contain errors or omissions. Always rely on the printed label itself and the official FDA labeling, and consult a pharmacist or healthcare professional with any questions about this product.