Sumatriptan
Product Images NDC 68071-2825

View Photos of Packaging, Regulatory Labels, and Product Appearance

Product Visual Gallery

This gallery contains 4 technical images submitted to the FDA as part of the official labeling for Sumatriptan (NDC 68071-2825). Unlike standard consumer photos, these assets often include clinical data figures, molecular chemical structures, and official manufacturer packaging layouts.

As provided by Nucare Pharmaceuticals,inc., these visuals offer a comprehensive scientific overview of the product's physical and chemical identity, aiding pharmacists and researchers in product verification and study.

FDA Label Image

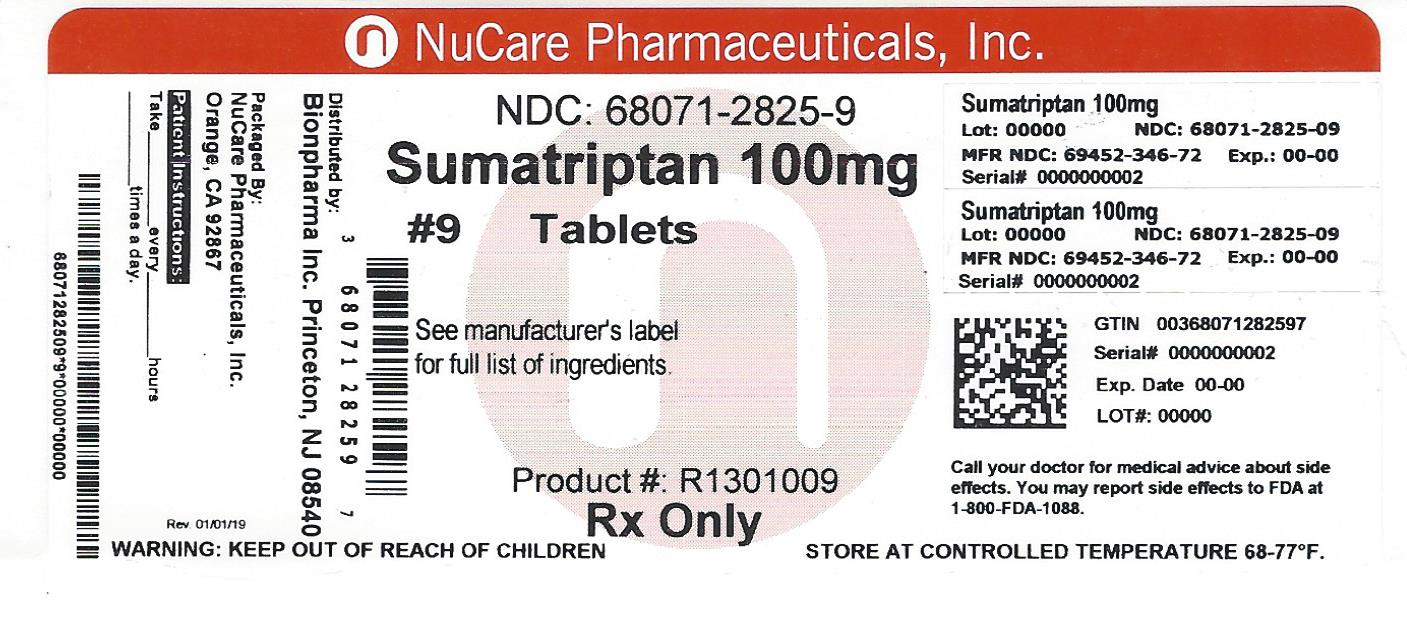
Pdp (68071 2825 9)

Pdp (68071 2825 9)
Label for Sumatriptan 100 mg tablets by NuCare Pharmaceuticals, Inc., distributed by Blonpharma Inc. The label indicates prescription only (Rx Only) and includes NDC 68071-2825-9, product number R1301009, and a package count of 9 tablets. It advises keeping the product out of reach of children and storing at 68-77°F, with instructions to see the manufacturer's label for a full list of ingredients.*
FDA Label Image

Chemical Structure (Sumatriptan Figure 1)

Chemical Structure (Sumatriptan Figure 1)
Chemical structure of sumatriptan, displayed as a molecular diagram with labeled functional groups including a sulfonamide, indole ring, and an aminoethyl side chain, along with a succinate moiety indicating its salt form.*
FDA Label Image

Figure 1 (Sumatriptan Figure 2)

Figure 1 (Sumatriptan Figure 2)
A line graph showing the estimated probability of response on the y-axis and time in minutes from the initial dose on the x-axis. The graph compares response probabilities over 240 minutes for placebo, and Sumatriptan doses of 25 mg, 50 mg, and 100 mg, with response rates increasing over time for all but higher for the active doses compared to placebo.*
FDA Label Image

Figure 2 (Sumatriptan Figure 3)

Figure 2 (Sumatriptan Figure 3)
A graph showing the estimated probability of remediation or rescue over time in hours from initial dose, comparing placebo and Sumatriptan doses of 25 mg, 50 mg, and 100 mg. The y-axis represents the probability from 0% to 100%, and the x-axis represents time up to 24 hours. The placebo group shows the highest probability over time, while the 100 mg group shows the lowest.*

* About these descriptions: Image descriptions on this page are generated by automated AI analysis of the product label images from the manufacturer's FDA label submission (SPL). They are provided for reference only and may contain errors or omissions. Always rely on the printed label itself and the official FDA labeling, and consult a pharmacist or healthcare professional with any questions about this product.