Product Images Sildenafil

View Photos of Packaging, Labels & Appearance

Product Label Images

The following 10 images provide visual information about the product associated with Sildenafil NDC 68071-2898 by Nucare Pharmaceuticals,inc., such as packaging, labeling, and the appearance of the drug itself. This resource could be helpful for medical professionals, pharmacists, and patients seeking to verify medication information and ensure they have the correct product.

pdp - 68071 2898 3

pdp - 68071 2898 3

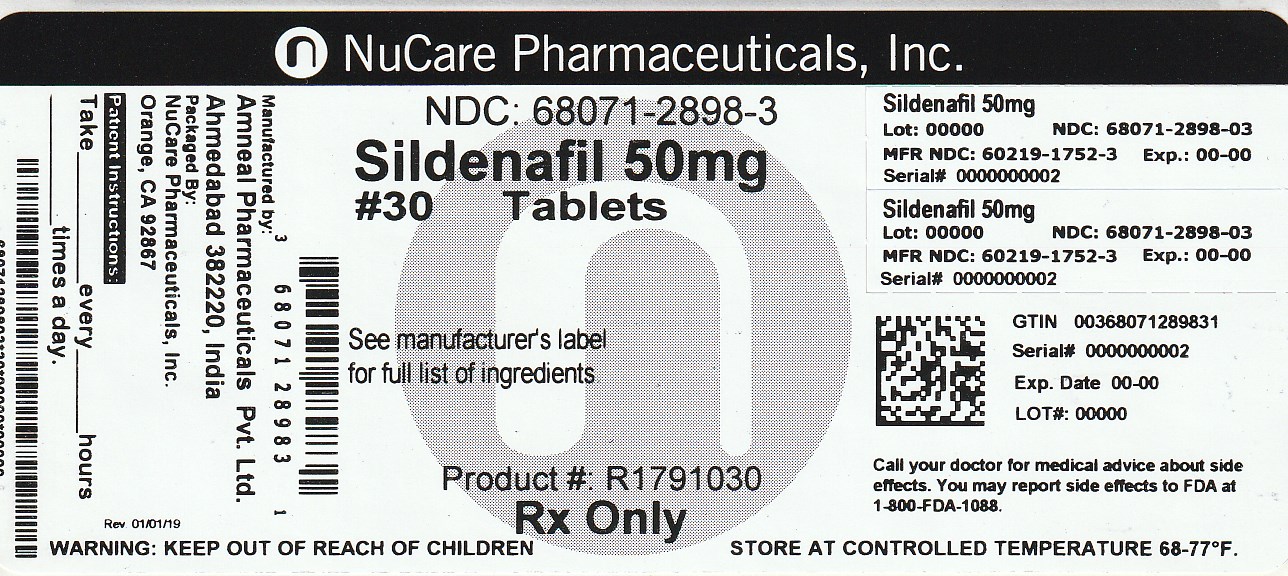
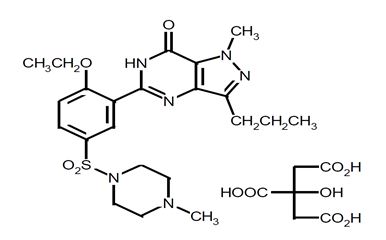
This is a description of a medication containing Sildenafil 50mg. The package includes the Lot number and NDC number, as well as the manufacturing NDC and an expiration date. The medication includes warnings to keep out of reach of children and to store at a controlled temperature. The packet also provides information on possible side effects of the medication and contact information for reporting side effects to the FDA.*

10 - sildenafil tablets 25 50 100 1

10 - sildenafil tablets 25 50 100 1

10 - sildenafil tablets 25 50 100 2

10 - sildenafil tablets 25 50 100 2

This is a chart showing the Systolic Blood Pressure (mmHg) and Time post dose (hrs) for Sildenafil 100mg and placebo. The chart only shows the data points for 15 mmHg, 25 mmHg, 20 hrs, and 24hrs, with some additional points at 12 and 16, but without detailed values or a legend.*

10 - sildenafil tablets 25 50 100 3

10 - sildenafil tablets 25 50 100 3

This appears to be a chart showing the change in SBP (systolic blood pressure) in mmHg over time post-dose (in hours) for a study comparing Doxazosin alone versus Doxazosin plus Sildenafil 25 mg. The values range from +20 mmHg to -40 mmHg.*

10 - sildenafil tablets 25 50 100 4

10 - sildenafil tablets 25 50 100 4

This is a graph showing the change in systolic blood pressure (SBP) in millimeters of mercury (mmHg) over time post dose (in hours) for two treatments: Doxazosin plus Placebo and Doxazosin plus Sildenafil 50 mg. The values range from -50 to 0.000 to 8.000, but without additional context or a visualization it is difficult to provide a more detailed description.*

10 - sildenafil tablets 25 50 100 5

10 - sildenafil tablets 25 50 100 5

10 - sildenafil tablets 25 50 100 6

10 - sildenafil tablets 25 50 100 6

10 - sildenafil tablets 25 50 100 7

10 - sildenafil tablets 25 50 100 7

10 - sildenafil tablets 25 50 100 8

10 - sildenafil tablets 25 50 100 8

10 - sildenafil tablets 25 50 100 9

10 - sildenafil tablets 25 50 100 9

This seems to be a table showing the percentage of improvement in different groups after taking various dosages of Placebo and Sildenafil. The table compares the effectiveness of different dosages of Sildenafil as compared to Placebo. There are some symbols, but no clear description is available, making it difficult to interpret.*

* The product label images have been analyzed using a combination of traditional computing and machine learning techniques. It should be noted that the descriptions provided may not be entirely accurate as they are experimental in nature. Use the information in this page at your own discretion and risk.