Sildenafil Tablet, Film Coated
Product Images NDC 68071-2985

View Photos of Packaging, Regulatory Labels, and Product Appearance

Product Visual Gallery

This gallery contains 10 technical images submitted to the FDA as part of the official labeling for Sildenafil (NDC 68071-2985). Unlike standard consumer photos, these assets often include clinical data figures, molecular chemical structures, and official manufacturer packaging layouts.

As provided by Nucare Pharmaceuticals,inc., these visuals offer a comprehensive scientific overview of the product's physical and chemical identity, aiding pharmacists and researchers in product verification and study.

FDA Label Image

Pdp (68071 2985 3)

Pdp (68071 2985 3)
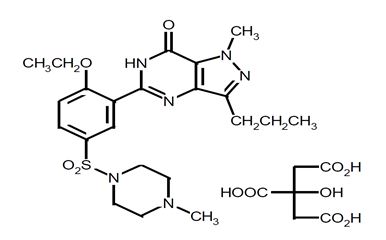
NuCare Pharmaceuticals Inc. produces a medication named Sildenafil 100mg. This medication has Lot number 00000 and NDC 68071-2985-03. Two units of this medication have serial numbers 0000000002. It is recommended to store this medication at a controlled temperature of 68-77°F. In case of any side effects, patients may report them to FDA at 1-800-FDA-1088.*
FDA Label Image

10 (Sildenafil Tablets 25 50 100 1)

FDA Label Image

10 (Sildenafil Tablets 25 50 100 2)

FDA Label Image

10 (Sildenafil Tablets 25 50 100 3)

10 (Sildenafil Tablets 25 50 100 3)
This is a graph showing the change in systolic blood pressure (SBP) in mmHg over time (in hours) after the administration of Doxazosin alone and in combination with Sildenafil 25mg. The graph shows a decrease in SBP for both treatments, with a more significant decrease observed when Doxazosin was combined with Sildenafil 25mg.*
FDA Label Image

10 (Sildenafil Tablets 25 50 100 4)

10 (Sildenafil Tablets 25 50 100 4)
This appears to be a graph displaying the change in systolic blood pressure (SBP) in millimeters of mercury (mmHg) over time in hours. The graph shows the comparison between two treatments: Doxazosin + Placebo and Doxazosin + Sildenafil 50 mg. The values on the y-axis range from -50 to 0, indicating a decrease in SBP. The x-axis displays time post-dose in hours, ranging from 0 to 8 hours.*
FDA Label Image

10 (Sildenafil Tablets 25 50 100 5)

10 (Sildenafil Tablets 25 50 100 5)
This is a chart showing blood pressure measurements in millimeters of mercury (mmHg) over time after administering different treatments (Doxazosin and Sildenafil, Doxazosin and Placebo). There is no other information available.*
FDA Label Image

10 (Sildenafil Tablets 25 50 100 6)

10 (Sildenafil Tablets 25 50 100 6)
This data appears to be a table showing plasma concentrations (in ng/ml) at different time points post dose (in hrs) for a commercial tablet treatment. However, without more context or information, it is difficult to provide a more detailed or specific description of the data.*
FDA Label Image

10 (Sildenafil Tablets 25 50 100 7)

FDA Label Image

10 (Sildenafil Tablets 25 50 100 8)

FDA Label Image

10 (Sildenafil Tablets 25 50 100 9)

10 (Sildenafil Tablets 25 50 100 9)
This seems to be a table or chart containing percentages and values related to different dosages of Placebo and Sildenafil. The treatments were allocated in different groups, and there is a test result indicating a significant difference among the groups. However, without more context or understanding of the subject matter, it's not possible to provide a more detailed description.*

* These product label images have been analyzed using experimental machine learning. Please verify findings with the primary label text.