Finasteride Tablet, Film Coated
Product Images NDC 68071-2999

View Photos of Packaging, Regulatory Labels, and Product Appearance

Product Visual Gallery

This gallery contains 6 technical images submitted to the FDA as part of the official labeling for Finasteride (NDC 68071-2999). Unlike standard consumer photos, these assets often include clinical data figures, molecular chemical structures, and official manufacturer packaging layouts.

As provided by Nucare Pharmaceuticals,inc., these visuals offer a comprehensive scientific overview of the product's physical and chemical identity, aiding pharmacists and researchers in product verification and study.

FDA Label Image

Pdp (68071 2999 9)

Pdp (68071 2999 9)
Finasteride 5 mg tablets label from NuCare Pharmaceuticals, Inc. It includes NDC 68071-2999-9 and contains 90 film-coated tablets. The label provides manufacturer information (Akem Laboratories Ltd., India), patient instructions to take once every day, and storage details at controlled temperature 68-77°F. It also displays warnings and barcode data.*
FDA Label Image

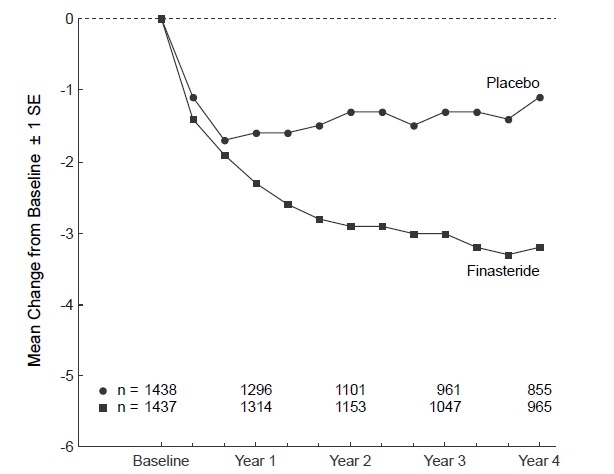
Finasteride-fig.1 (Finasteride Fig.1)

Finasteride-fig.1 (Finasteride Fig.1)
A line graph showing mean change from baseline ± standard error over a four-year period. The graph compares two groups: one receiving Finasteride and the other a placebo. The y-axis indicates the mean change values, and the x-axis shows time points from baseline through years 1 to 4. Finasteride data points are lower than placebo throughout the years, indicating a difference in effect.*
FDA Label Image

Finasteride-fig.5 (Finasteride Fig.5)

Finasteride-fig.5 (Finasteride Fig.5)
A line graph depicting the percentage of subjects with an event over years from randomization, comparing four groups: Placebo, Finasteride, Doxazosin, and a Combination treatment. The y-axis shows percent with event (0 to 25%), and the x-axis shows years from randomization (0 to 5.5 years). Each group is represented by different markers and lines illustrating their event rates over time.*
FDA Label Image

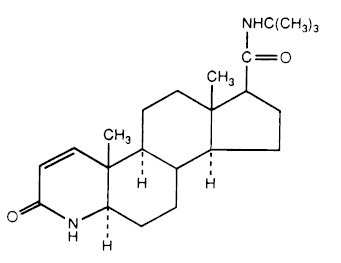
Structutre (Finasteride Structure)

Structutre (Finasteride Structure)
Chemical structure of Finasteride, showing its steroidal backbone with specific functional groups including a ketone and an amide moiety.*
FDA Label Image

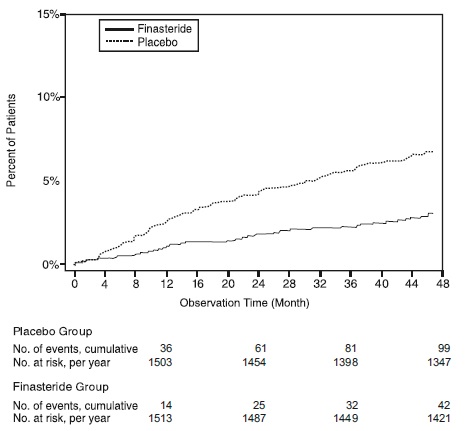
Finasteride-fig.3 (Finasteride Fig.3)

Finasteride-fig.3 (Finasteride Fig.3)
A line graph comparing the cumulative percent of patients experiencing an event over 48 months between Finasteride and placebo groups. The x-axis shows observation time in months (0 to 48), while the y-axis shows percent of patients (0% to 15%). The Finasteride group has a lower cumulative event rate than the placebo group. A table below details the cumulative number of events and number of patients at risk annually for both groups.*
FDA Label Image

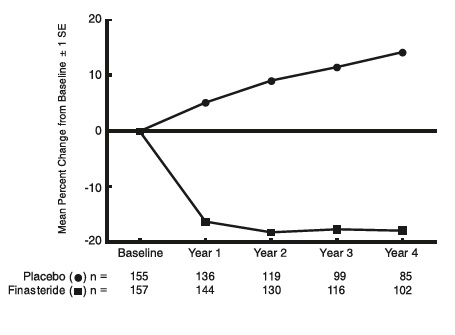
Finasteride-fig4a (Finasteride Fig4a)

Finasteride-fig4a (Finasteride Fig4a)
A line graph showing the mean percent change from baseline over a four-year period for two groups: placebo and finasteride. The graph plots values at baseline, year 1 through year 4, with the placebo group showing an increasing positive change, while the finasteride group consistently shows a negative change. Sample sizes for each group at each time point are indicated below the x-axis.*

* About these descriptions: Image descriptions on this page are generated by automated AI analysis of the product label images from the manufacturer's FDA label submission (SPL). They are provided for reference only and may contain errors or omissions. Always rely on the printed label itself and the official FDA labeling, and consult a pharmacist or healthcare professional with any questions about this product.