Gabapentin Tablet
Product Images NDC 68071-3445

View Photos of Packaging, Regulatory Labels, and Product Appearance

Product Visual Gallery

This gallery contains 17 technical images submitted to the FDA as part of the official labeling for Gabapentin (NDC 68071-3445). Unlike standard consumer photos, these assets often include clinical data figures, molecular chemical structures, and official manufacturer packaging layouts.

As provided by Nucare Pharmaceuticals,inc., these visuals offer a comprehensive scientific overview of the product's physical and chemical identity, aiding pharmacists and researchers in product verification and study.

FDA Label Image

600 mg-500s (600 mg 500s)
600 mg-500s (600 mg 500s)
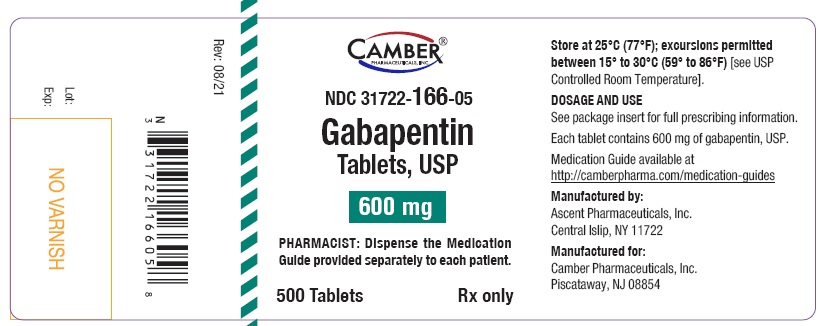
Gabapentin Tablets, USP 600 mg oral tablets label by Camber Pharmaceuticals, Inc. The label indicates 500 tablets per container, with instructions for pharmacists to dispense the medication guide. Storage conditions and manufacturing information from Ascent Pharmaceuticals, Inc. and Camber Pharmaceuticals, Inc. are included.*
FDA Label Image

600 mg-100s (600mg 100s)

600 mg-100s (600mg 100s)
Gabapentin Tablets, USP 600 mg oral tablets label from Camber Pharmaceuticals, Inc. This packaging label shows a 100-tablet bottle with storage instructions, dosage form, and manufacturer details. The NDC number is 31722-166-01, and it is labeled for prescription use only.*
FDA Label Image

800 mg-100s (800 mg 100s)

800 mg-100s (800 mg 100s)
Label for Gabapentin Tablets, USP 800 mg by Camber Pharmaceuticals, Inc., showing the NDC 31722-167-01. The label advises pharmacists to dispense the Medication Guide and states the package contains 100 tablets for prescription use only. Storage and manufacturer information for Ascent Pharmaceuticals and Camber Pharmaceuticals is included.*
FDA Label Image

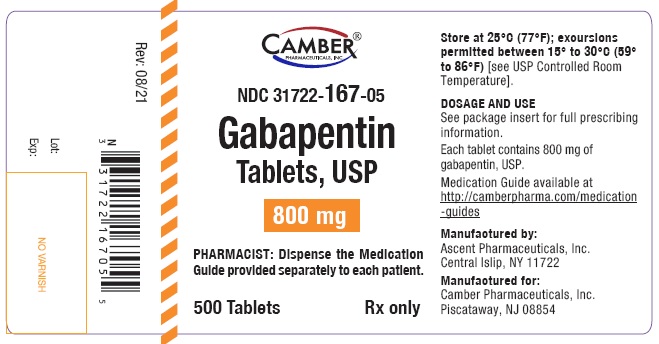
800 mg-500s (800 mg 500s)

800 mg-500s (800 mg 500s)
Label for Gabapentin Tablets, USP 800 mg by Camber Pharmaceuticals. The label indicates 500 tablets, prescription only, with storage instructions and directions to see the package insert for full dosing information. Manufactured by Ascent Pharmaceuticals and labeled for Camber Pharmaceuticals.*
FDA Label Image

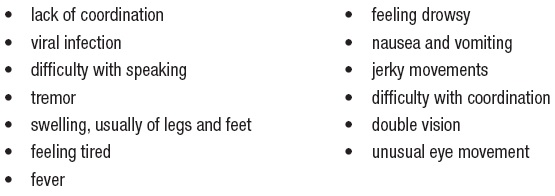
Sideeffects (Sideeffects)

Sideeffects (Sideeffects)
A text excerpt listing possible side effects or symptoms associated with a medication, including lack of coordination, viral infection, difficulty with speaking, tremor, swelling usually of legs and feet, feeling tired, fever, feeling drowsy, nausea and vomiting, jerky movements, difficulty with coordination, double vision, and unusual eye movement.*
FDA Label Image

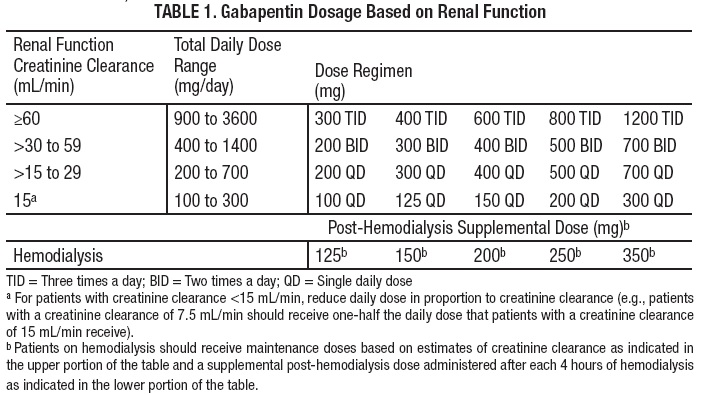
Table-1 (Table1)

Table-1 (Table1)
A table titled 'Gabapentin Dosage Based on Renal Function' showing dosage regimens based on creatinine clearance ranges in mL/min. It lists total daily dose ranges (mg/day) and specific dose regimens (mg) for various frequencies (TID, BID, QD). It also includes a section for post-hemodialysis supplemental doses in mg, with footnotes explaining dose adjustments for low creatinine clearance and hemodialysis patients.*
FDA Label Image

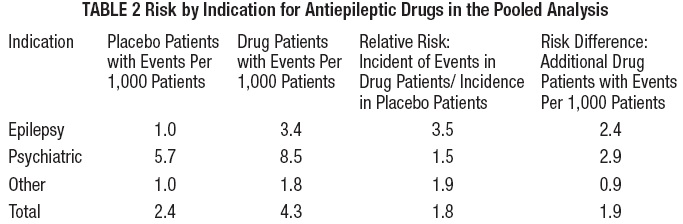
Table-2 (Table2)

Table-2 (Table2)
A table titled 'Risk by Indication for Antiepileptic Drugs in the Pooled Analysis' comparing events per 1,000 patients among placebo and drug patients across three indications: epilepsy, psychiatric, and other. The table includes relative risk and risk difference values showing incident events in drug versus placebo patients.*
FDA Label Image

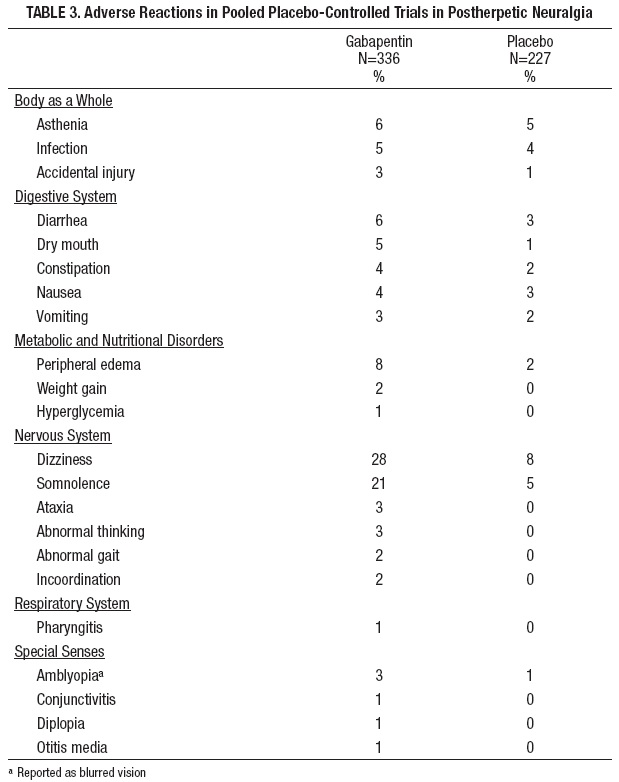
Table-3 (Table3)

Table-3 (Table3)
Data table showing adverse reactions reported in pooled placebo-controlled trials for gabapentin versus placebo in postherpetic neuralgia. The table lists various body systems and reactions, including asthenia, dizziness, somnolence, peripheral edema, and others, with their corresponding percentages for gabapentin (N=336) and placebo (N=227) groups.*
FDA Label Image

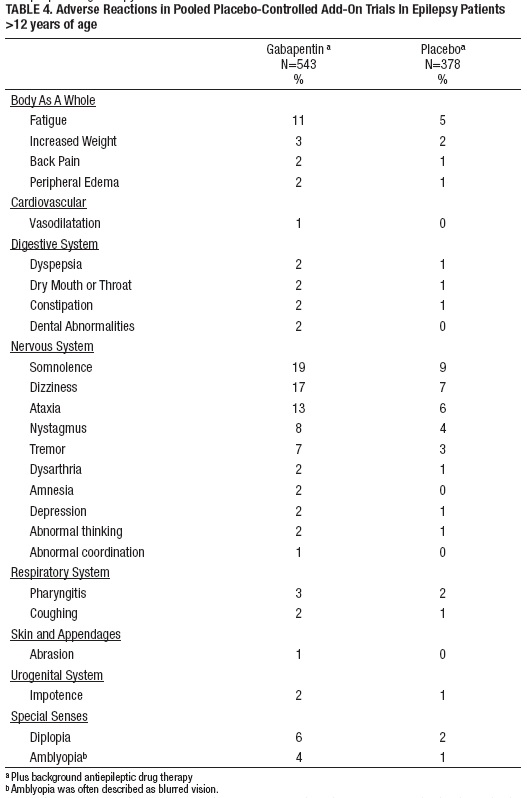
Table-4 (Table4)

Table-4 (Table4)
Data table titled 'Adverse Reactions in Pooled Placebo-Controlled Add-On Trials in Epilepsy Patients ≥12 years of age' comparing adverse reaction frequencies (%) between Gabapentin (N=543) and Placebo (N=378). Reactions are categorized by body system, including nervous and digestive systems, showing percentages for symptoms such as fatigue, somnolence, dizziness, diplopia, and others.*
FDA Label Image

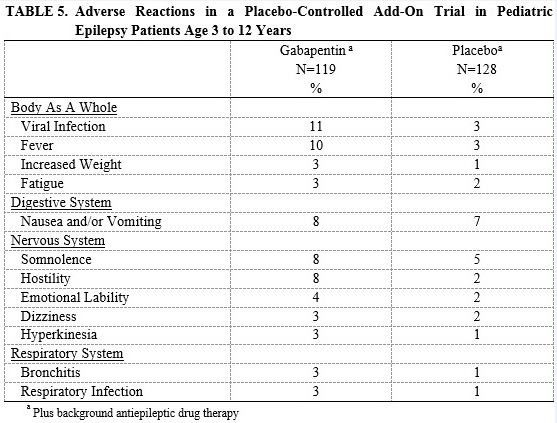
Table-5 (Table5)

Table-5 (Table5)
A table showing adverse reactions in a placebo-controlled add-on trial in pediatric epilepsy patients aged 3 to 12 years. It compares the percentage of patients experiencing specific side effects between Gabapentin (N=119) and placebo (N=128) groups across categories including Body as a Whole, Digestive System, Nervous System, and Respiratory System.*
FDA Label Image

Table-6 (Table6)

Table-6 (Table6)
A data table titled 'TABLE 6. Controlled PHN Studies: Duration, Dosages, and Number of Patients' showing study durations (7 and 8 weeks), gabapentin target doses in mg/day (1800, 2400, 3600), and patient counts receiving gabapentin or placebo across two studies, with totals included.*
FDA Label Image

Clcr (Clcr)

Clcr (Clcr)
An illustration showing the formula for calculating creatinine clearance (CLCr). The formula uses patient age, weight, and serum creatinine levels, with an adjustment factor for female patients.*
FDA Label Image

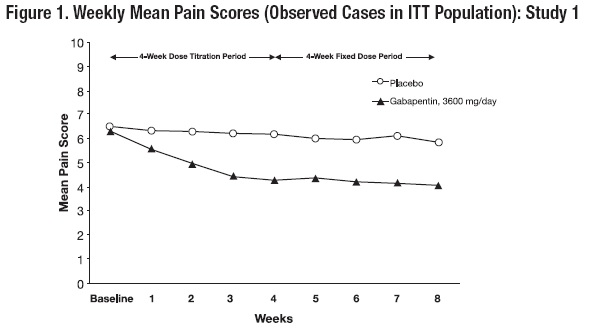
Figure-1 (Figure1)

Figure-1 (Figure1)
A line graph titled 'Weekly Mean Pain Scores (Observed Cases in ITT Population): Study 1' comparing placebo and Gabapentin 3600 mg/day groups over 8 weeks. The y-axis shows mean pain scores from 0 to 10, the x-axis represents weeks including baseline. Gabapentin group shows a decreasing pain score trend, while placebo remains nearly constant. The study includes a 4-week dose titration period followed by a 4-week fixed dose period.*
FDA Label Image

Figure-2 (Figure2)

Figure-2 (Figure2)
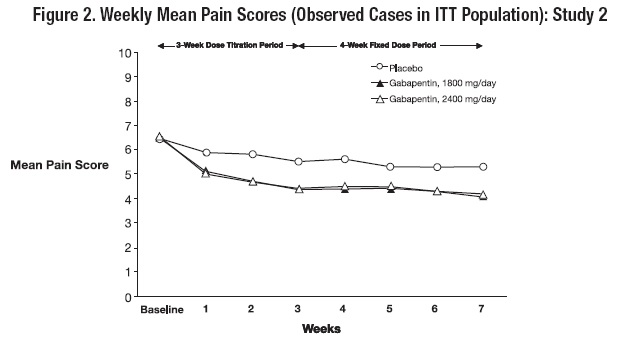
A line graph titled 'Weekly Mean Pain Scores' from a clinical study with three groups: placebo, gabapentin 1800 mg/day, and gabapentin 2400 mg/day. The x-axis shows weeks from baseline to 7, and the y-axis shows mean pain scores from 0 to 10. The graph depicts pain scores decreasing over time for the gabapentin groups compared to placebo, with a 3-week dose titration period followed by a 4-week fixed dose period.*
FDA Label Image

Figure-3 (Figure3)

Figure-3 (Figure3)
A bar chart titled 'Proportion of Responders (patients with ≥50% reduction in pain score) at Endpoint: Controlled PHN Studies' comparing placebo (PBO) and gabapentin (GBP) doses in two studies. The chart shows higher response rates for gabapentin doses (29% for GBP 3600 in Study 1; 32% and 34% for GBP 1800 and GBP 2400 in Study 2) versus placebo (12% and 14%). Statistical significance is indicated with asterisks for gabapentin groups.*
FDA Label Image

Figure-4 (Figure4)

Figure-4 (Figure4)
A scatter plot chart titled 'Responder Rate in Patients Receiving Gabapentin Expressed as a Difference from Placebo by Dose and Study' showing data from adjunctive therapy studies in patients 12 years and older with partial seizures. The x-axis represents daily dose of gabapentin in mg (600, 900, 1200, 1800), and the y-axis shows percentage difference from placebo. Data points are shown for three studies labeled a, b, and c, with study a represented by black squares, study b by gray squares, and study c by white squares.*
FDA Label Image

Struc (Struct)

Struc (Struct)
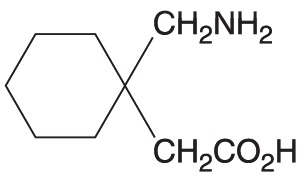
Chemical structure of the active ingredient Gabapentin, showing a cyclohexane ring attached to an amino methyl group and a carboxymethyl group.*

* About these descriptions: Image descriptions on this page are generated by automated AI analysis of the product label images from the manufacturer's FDA label submission (SPL). They are provided for reference only and may contain errors or omissions. Always rely on the printed label itself and the official FDA labeling, and consult a pharmacist or healthcare professional with any questions about this product.