Tamsulosin Hydrochloride
Product Images NDC 68071-3467

View Photos of Packaging, Regulatory Labels, and Product Appearance

Product Visual Gallery

This gallery contains 7 technical images submitted to the FDA as part of the official labeling for Tamsulosin Hydrochloride (NDC 68071-3467). Unlike standard consumer photos, these assets often include clinical data figures, molecular chemical structures, and official manufacturer packaging layouts.

As provided by Nucare Pharmaceuticals,inc., these visuals offer a comprehensive scientific overview of the product's physical and chemical identity, aiding pharmacists and researchers in product verification and study.

FDA Label Image

Pdp (68071 3467 1)

Pdp (68071 3467 1)
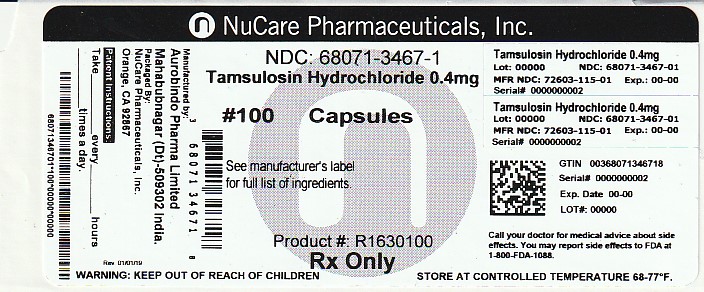
Label for Tamsulosin Hydrochloride 0.4 mg capsules by NuCare Pharmaceuticals, Inc., showing NDC 68071-3467-1, lot and expiration placeholders, and storage instructions. The label indicates prescription use (Rx Only) with a count of 100 capsules and cautions to keep out of children's reach.*
FDA Label Image

Figure (Tamsulosin Fig1)

Figure (Tamsulosin Fig1)
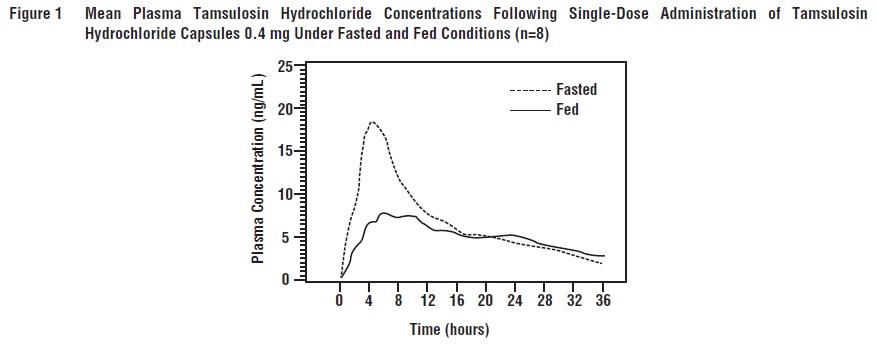
Line graph depicting mean plasma concentrations of Tamsulosin Hydrochloride over 36 hours following a single 0.4 mg capsule dose under fasted and fed conditions. The plasma concentration (ng/mL) is shown on the vertical axis, and time (hours) on the horizontal axis, illustrating differences in drug concentration between fasted and fed states.*
FDA Label Image

Figure (Tamsulosin Fig2)

Figure (Tamsulosin Fig2)
Line chart titled 'Mean Change from Baseline in Total AUA Symptom Score (0 to 35) Study 1' showing mean symptom score changes over treatment duration in weeks. It compares three treatments: 0.8 mg, 0.4 mg, and placebo. The y-axis indicates mean change, and the x-axis shows weeks of treatment with sample sizes noted below each point.*
FDA Label Image

Figure (Tamsulosin Fig3)

Figure (Tamsulosin Fig3)
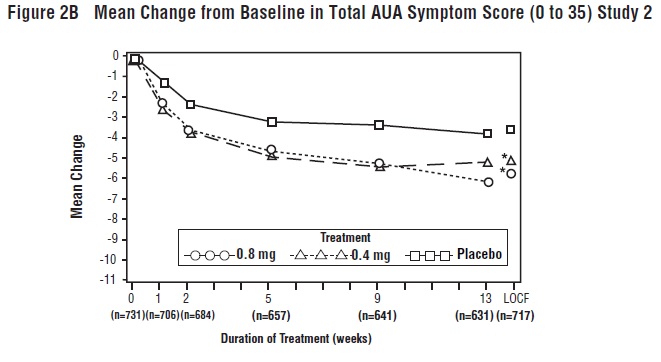
A line chart titled 'Mean Change from Baseline in Total AUA Symptom Score (0 to 35) Study 2' showing mean change on the vertical axis against duration of treatment in weeks on the horizontal axis. The chart compares treatment groups receiving 0.8 mg, 0.4 mg of Tamsulosin Hydrochloride, and a placebo over approximately 13 weeks, with mean scores decreasing most for the 0.8 mg group, followed by 0.4 mg, while placebo shows the least change.*
FDA Label Image

Figure (Tamsulosin Fig4)

Figure (Tamsulosin Fig4)
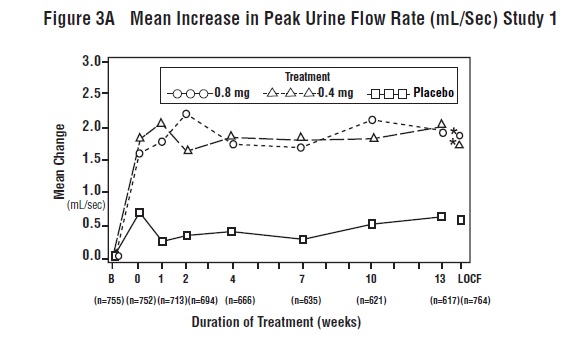
A line graph titled 'Figure 3A Mean Increase in Peak Urine Flow Rate (mL/Sec) Study 1' showing mean change in urine flow rate over treatment duration in weeks. It compares three treatments: 0.8 mg, 0.4 mg Tamsulosin Hydrochloride, and placebo, with the active doses showing higher increases than placebo over time.*
FDA Label Image

Figure (Tamsulosin Fig5)

Figure (Tamsulosin Fig5)
A line graph titled 'Figure 3B Mean Increase in Peak Urine Flow Rate (mL/Sec) Study 2' showing mean change in urine flow rate over treatment duration in weeks. The graph compares three treatments: 0.8 mg, 0.4 mg, and placebo, with different line styles and markers. The x-axis represents treatment duration in weeks, and the y-axis shows mean change in urine flow rate (L/sec). Sample sizes at each time point are noted below the x-axis.*
FDA Label Image

Chemical Structure (Tamsulosin Str)

Chemical Structure (Tamsulosin Str)
Chemical structure diagram of Tamsulosin Hydrochloride showing its molecular components and arrangement, including aromatic rings, side chains, and hydrochloride moiety.*

* About these descriptions: Image descriptions on this page are generated by automated AI analysis of the product label images from the manufacturer's FDA label submission (SPL). They are provided for reference only and may contain errors or omissions. Always rely on the printed label itself and the official FDA labeling, and consult a pharmacist or healthcare professional with any questions about this product.