Gabapentin Tablet, Coated
Product Images NDC 68071-3523

View Photos of Packaging, Regulatory Labels, and Product Appearance

Product Visual Gallery

This gallery contains 6 technical images submitted to the FDA as part of the official labeling for Gabapentin (NDC 68071-3523). Unlike standard consumer photos, these assets often include clinical data figures, molecular chemical structures, and official manufacturer packaging layouts.

As provided by Nucare Pharmaceuticals,inc., these visuals offer a comprehensive scientific overview of the product's physical and chemical identity, aiding pharmacists and researchers in product verification and study.

FDA Label Image

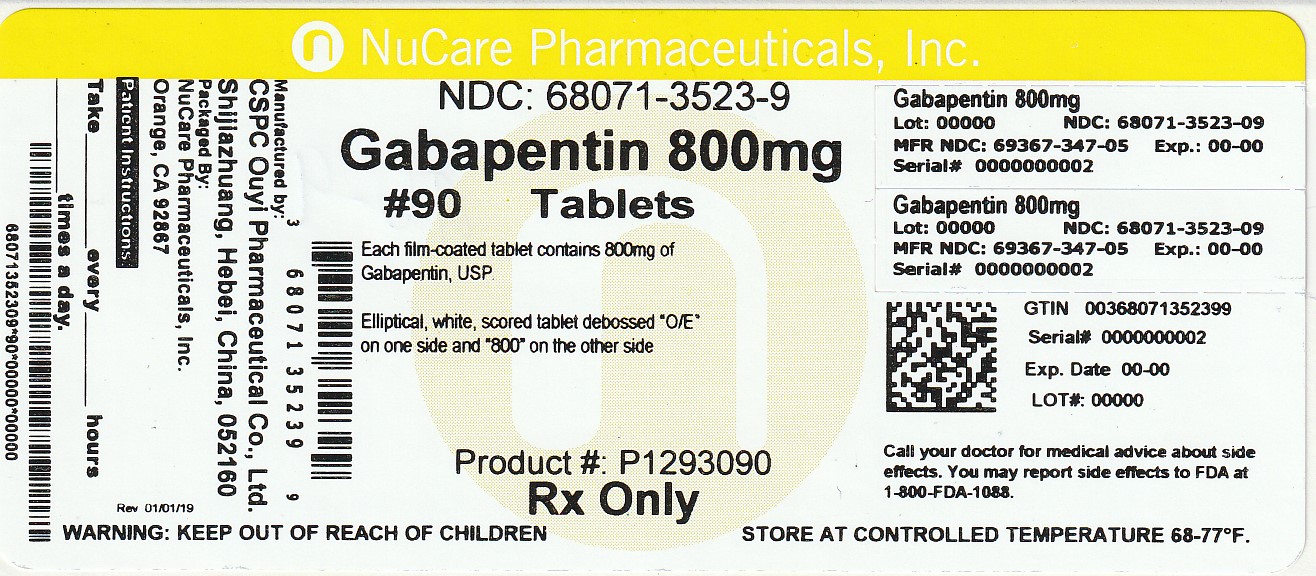
Pdp (68071 3523 9)

Pdp (68071 3523 9)
Gabapentin 800 mg coated tablets label from NuCare Pharmaceuticals, Inc. The label indicates a count of 90 tablets, each elliptical, white, and scored with debossed markings "OE" and "800". It includes the NDC 68071-3523-9 and storage instructions, along with manufacturer details and standard regulatory warnings.*
FDA Label Image

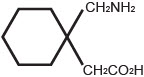
Chemical Structure (Gabapenin 01)

Chemical Structure (Gabapenin 01)
Chemical structure of gabapentin showing a cyclohexane ring with two side chains, one containing an amino group (CH2NH2) and the other a carboxyl group (CH2CO2H).*
FDA Label Image

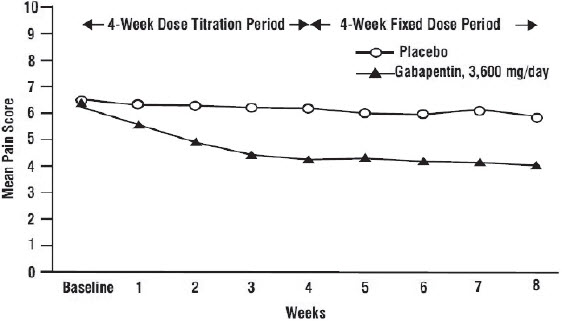
Figure 1 (Gabapenin 02)

Figure 1 (Gabapenin 02)
A line graph depicting mean pain scores over an 8-week period in a clinical study. The x-axis shows weeks from baseline to 8, including a 4-week dose titration period and a 4-week fixed dose period. The y-axis measures mean pain score from 0 to 9. Two lines represent treatment groups: placebo and Gabapentin 3,600 mg/day, with the Gabapentin group showing a gradual decrease in pain score compared to placebo.*
FDA Label Image

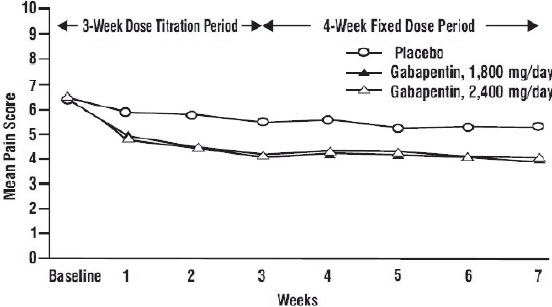
Figure 2 (Gabapenin 03)

Figure 2 (Gabapenin 03)
A line graph showing mean pain scores over a 7-week period, including a 3-week dose titration and a 4-week fixed dose period. It compares placebo with Gabapentin at dosages of 1,800 mg/day and 2,400 mg/day, with mean pain scores plotted on the vertical axis and weeks on the horizontal axis.*
FDA Label Image

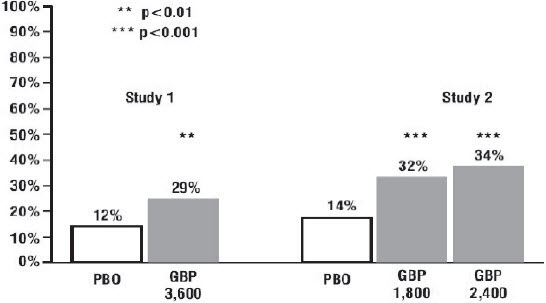
Figure 3 (Gabapenin 04)

Figure 3 (Gabapenin 04)
A bar chart comparing percentage values across two studies between placebo (PBO) and gabapentin (GBP) at doses 1,800 mg, 2,400 mg, and 3,600 mg. It includes statistical significance indicators with p-values less than 0.01 and 0.001, showing higher percentages for gabapentin doses in both studies.*
FDA Label Image

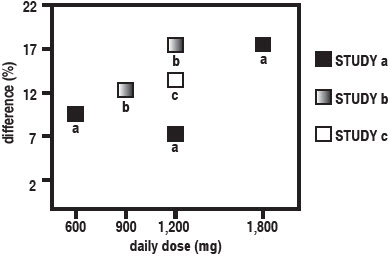
Figure 4 (Gabapenin 05)

Figure 4 (Gabapenin 05)
A scatter plot comparing the percentage difference in an unspecified measure across three studies (a, b, c) at varying daily doses of gabapentin (600 mg, 900 mg, 1200 mg, and 1800 mg). The graph shows data points for each study at each dose level with differences on the y-axis and daily dose in mg on the x-axis.*

* About these descriptions: Image descriptions on this page are generated by automated AI analysis of the product label images from the manufacturer's FDA label submission (SPL). They are provided for reference only and may contain errors or omissions. Always rely on the printed label itself and the official FDA labeling, and consult a pharmacist or healthcare professional with any questions about this product.