Venlafaxine Hydrochloride Capsule, Extended Release
Product Images NDC 68071-3638

View Photos of Packaging, Regulatory Labels, and Product Appearance

Product Visual Gallery

This gallery contains 5 technical images submitted to the FDA as part of the official labeling for Venlafaxine Hydrochloride (NDC 68071-3638). Unlike standard consumer photos, these assets often include clinical data figures, molecular chemical structures, and official manufacturer packaging layouts.

As provided by Nucare Pharmaceuticals,inc., these visuals offer a comprehensive scientific overview of the product's physical and chemical identity, aiding pharmacists and researchers in product verification and study.

FDA Label Image

Pdp (68071 3638 3)

Pdp (68071 3638 3)
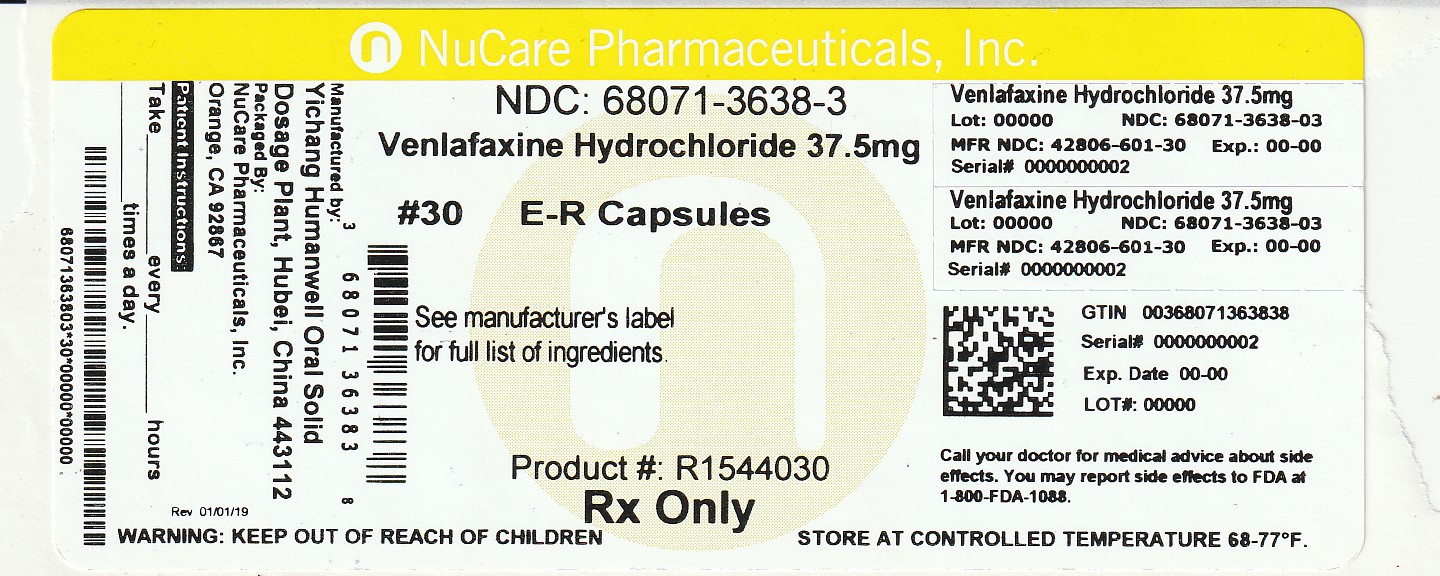
Label for Venlafaxine Hydrochloride 37.5 mg extended-release capsules by NuCare Pharmaceuticals, Inc. The label includes NDC 68071-3638, package size of 30 capsules, dosing instructions, manufacturer details, and warnings to keep out of reach of children and store at controlled temperature between 68-77°F.*
FDA Label Image

Image-01 (Image 01)

Image-01 (Image 01)
Chemical structure of venlafaxine hydrochloride showing its molecular framework with key functional groups and the hydrochloride salt indicated.*
FDA Label Image

Image-02 (Image 02)

Image-02 (Image 02)
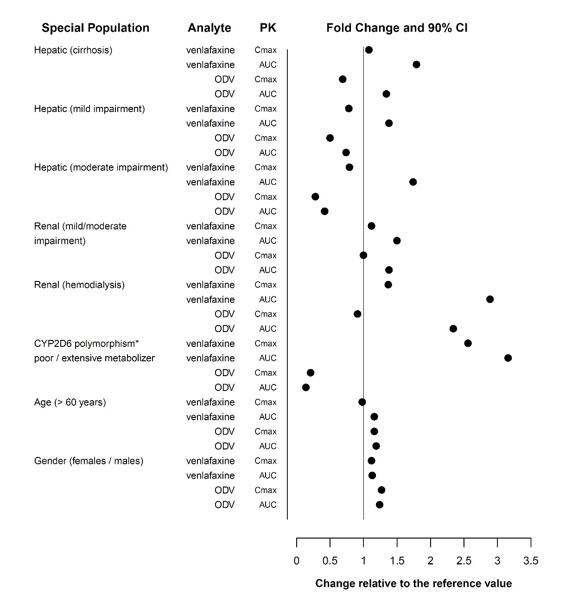
A scatter plot showing the fold change and 90% confidence intervals in pharmacokinetic parameters (Cmax and AUC) of venlafaxine and its O-desmethylvenlafaxine (ODV) metabolite across various special populations, including hepatic cirrhosis, mild and moderate hepatic impairment, renal impairment including hemodialysis, CYP2D6 polymorphism, age over 60 years, and gender. The x-axis represents change relative to the reference value.*
FDA Label Image

Image-03 (Image 03)

Image-03 (Image 03)
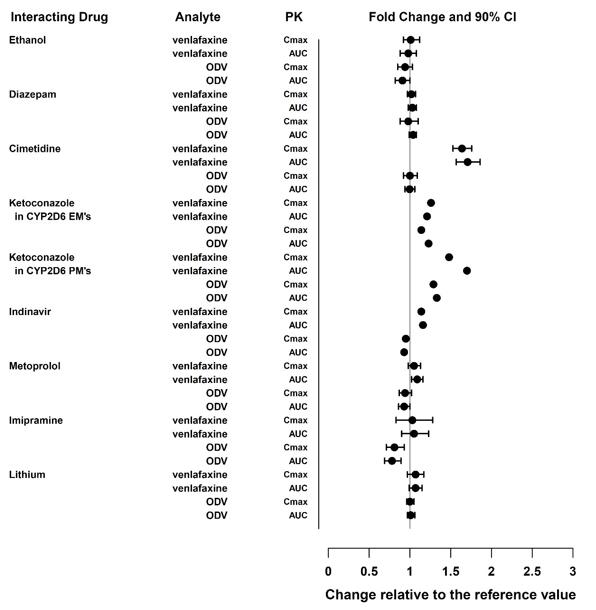
A dot plot chart showing fold changes and 90% confidence intervals for pharmacokinetic parameters (Cmax and AUC) of venlafaxine and its ODV metabolite with various interacting drugs. The x-axis shows change relative to the reference value, and interacting drugs include ethanol, diazepam, cimetidine, ketoconazole, indinavir, metoprolol, imipramine, and lithium.*
FDA Label Image

Image-04 (Image 04)

Image-04 (Image 04)
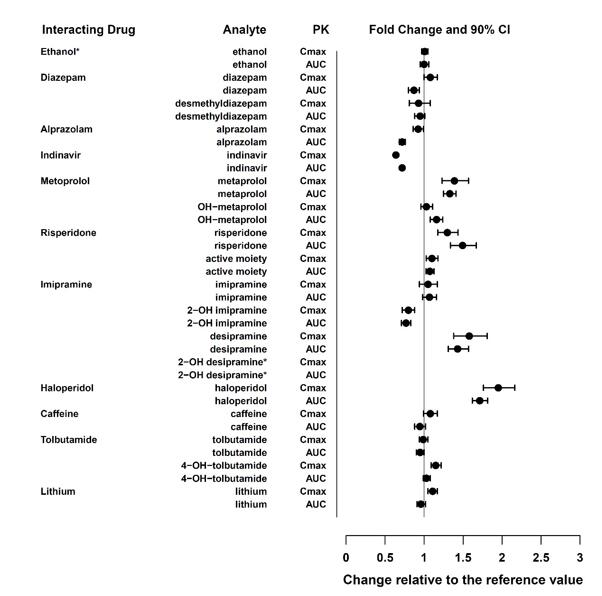
A dot plot chart showing fold change and 90% confidence intervals for pharmacokinetic parameters Cmax and AUC of various analytes when interacting with several drugs relative to a reference value. The x-axis represents the change relative to the reference value, ranging from 0 to 3. Drugs analyzed include ethanol, diazepam, alprazolam, indinavir, metoprolol, risperidone, imipramine, haloperidol, caffeine, tolbutamide, and lithium.*

* About these descriptions: Image descriptions on this page are generated by automated AI analysis of the product label images from the manufacturer's FDA label submission (SPL). They are provided for reference only and may contain errors or omissions. Always rely on the printed label itself and the official FDA labeling, and consult a pharmacist or healthcare professional with any questions about this product.