Amlodipine Besylate Tablet
Product Images NDC 68071-3698

View Photos of Packaging, Regulatory Labels, and Product Appearance

Product Visual Gallery

This gallery contains 4 technical images submitted to the FDA as part of the official labeling for Amlodipine Besylate (NDC 68071-3698). Unlike standard consumer photos, these assets often include clinical data figures, molecular chemical structures, and official manufacturer packaging layouts.

As provided by Nucare Pharmaceuticals,inc., these visuals offer a comprehensive scientific overview of the product's physical and chemical identity, aiding pharmacists and researchers in product verification and study.

FDA Label Image

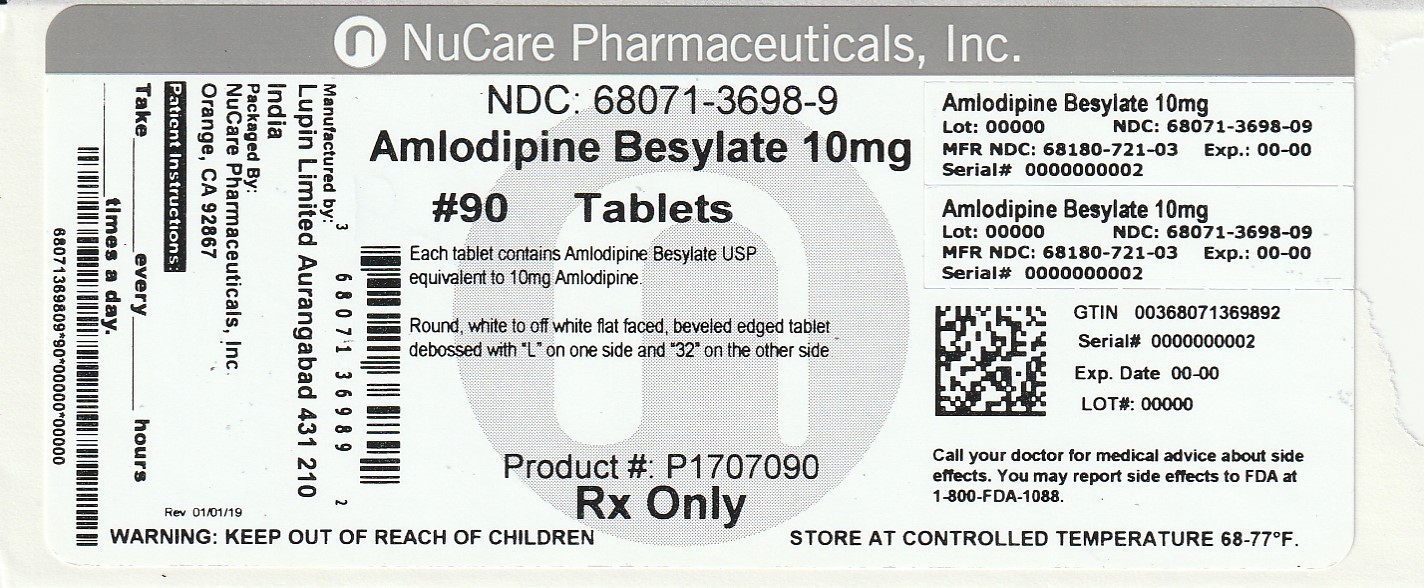
Pdp (68071 3698 9)

Pdp (68071 3698 9)
Pharmaceutical label for Amlodipine Besylate 10 mg tablets from NuCare Pharmaceuticals, Inc. The label indicates a quantity of 90 tablets and describes the tablet as round, white to off-white, flat-faced, and beveled-edged. The product is labeled Rx Only and includes storage instructions and manufacturer details.*
FDA Label Image

Amlodipine Besylate (99f197ee 0a14 4981 A816 A1570a5a8da7 01)

Amlodipine Besylate (99f197ee 0a14 4981 A816 A1570a5a8da7 01)
Chemical structure of amlodipine besylate, showing the molecular arrangement of the amlodipine molecule complexed with a benzenesulfonic acid moiety (besylate).*
FDA Label Image

Figure 1 (Kaplan-Meier Analysis of Composite Clinical Outcomes for Amlodipine versus Placebo)

Figure 1 (Kaplan-Meier Analysis of Composite Clinical Outcomes for Amlodipine versus Placebo)
Kaplan-Meier analysis chart showing composite clinical outcomes event rate over time for Amlodipine versus Placebo groups. The graph plots event rates across 24 months, indicating lower event rates for Amlodipine compared to Placebo. Additional data include p-value, hazard ratio, and number of subjects at risk over time.*
FDA Label Image

Figure 2 (Effects on Primary Endpoint of Amlodipine versus Placebo across Sub-Groups)

Figure 2 (Effects on Primary Endpoint of Amlodipine versus Placebo across Sub-Groups)
A forest plot showing hazard ratios with 95% confidence intervals for various patient subgroups comparing Amlodipine versus placebo. Categories include overall patients, age groups, gender, baseline sitting systolic blood pressure, baseline vessel disease, baseline vessels with stenosis, and PCI-stent strata. The plot visually indicates which treatment is favored across these subgroups.*

* About these descriptions: Image descriptions on this page are generated by automated AI analysis of the product label images from the manufacturer's FDA label submission (SPL). They are provided for reference only and may contain errors or omissions. Always rely on the printed label itself and the official FDA labeling, and consult a pharmacist or healthcare professional with any questions about this product.