Tizanidine Tablet
Product Images NDC 68071-3719

View Photos of Packaging, Regulatory Labels, and Product Appearance

Product Visual Gallery

This gallery contains 5 technical images submitted to the FDA as part of the official labeling for Tizanidine (NDC 68071-3719). Unlike standard consumer photos, these assets often include clinical data figures, molecular chemical structures, and official manufacturer packaging layouts.

As provided by Nucare Pharmaceuticals, Inc., these visuals offer a comprehensive scientific overview of the product's physical and chemical identity, aiding pharmacists and researchers in product verification and study.

FDA Label Image

Pdp (68071 3719 3)

Pdp (68071 3719 3)
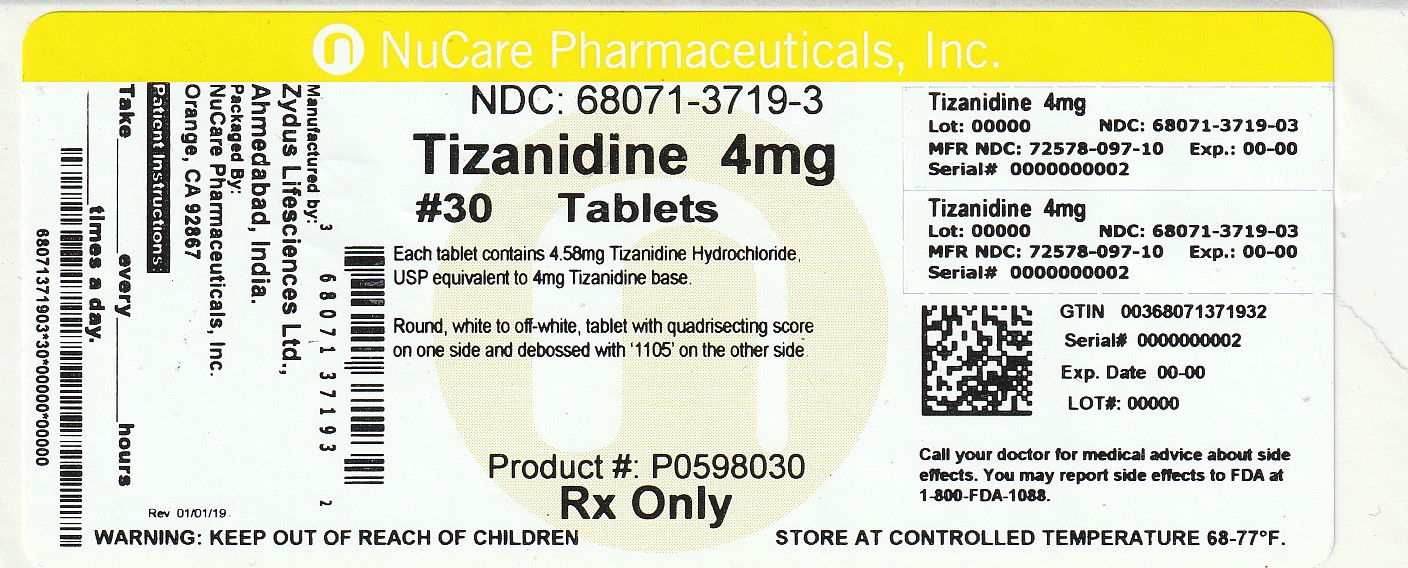
Label for tizanidine 4 mg tablets by NuCare Pharmaceuticals, Inc. The label indicates a count of 30 tablets per package and states each tablet contains 4.58 mg tizanidine hydrochloride USP equivalent to 4 mg tizanidine base. The label includes usage instructions, barcodes, lot number, expiration date, and storage temperature guidance.*
FDA Label Image

Figure (C1813e2d 81a1 4db6 80a3 12c265d1e8f5 01)

Figure (C1813e2d 81a1 4db6 80a3 12c265d1e8f5 01)
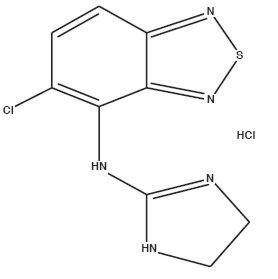
Chemical structure of tizanidine hydrochloride, showing its molecular framework with chlorine, nitrogen, sulfur, and hydrogen atoms arranged in heterocyclic rings.*
FDA Label Image

Figure (C1813e2d 81a1 4db6 80a3 12c265d1e8f5 02)

Figure (C1813e2d 81a1 4db6 80a3 12c265d1e8f5 02)
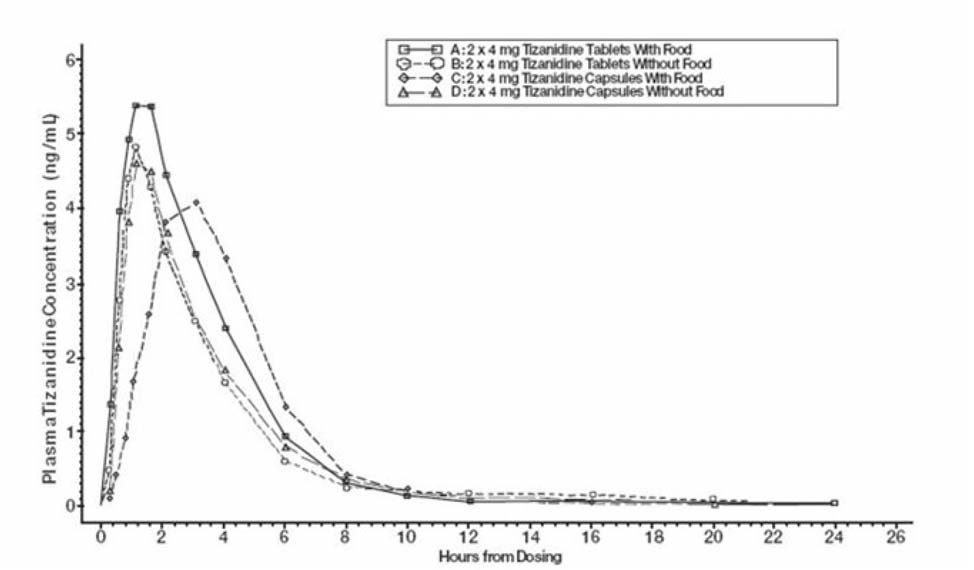
A pharmacokinetic graph depicting plasma tizanidine concentration (ng/mL) over time (hours) from dosing. The graph compares 4 mg tizanidine tablets and capsules taken with or without food, illustrating concentration changes up to 24 hours post-dose with four separate curves for each condition.*
FDA Label Image

Figure (C1813e2d 81a1 4db6 80a3 12c265d1e8f5 03)

Figure (C1813e2d 81a1 4db6 80a3 12c265d1e8f5 03)
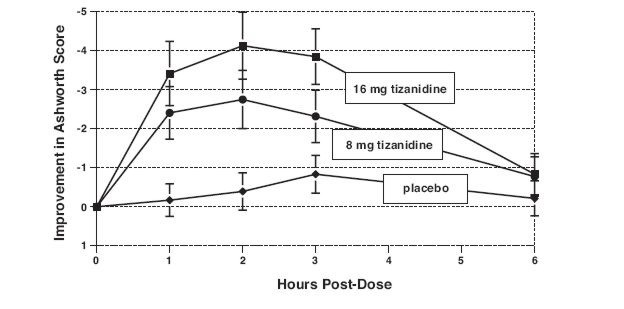
A line graph showing improvement in Ashworth score over time in hours post-dose. It compares three groups: 16 mg tizanidine, 8 mg tizanidine, and placebo, indicating changes in muscle tone improvement measured up to 6 hours after dosing.*
FDA Label Image

Figure (C1813e2d 81a1 4db6 80a3 12c265d1e8f5 04)

Figure (C1813e2d 81a1 4db6 80a3 12c265d1e8f5 04)
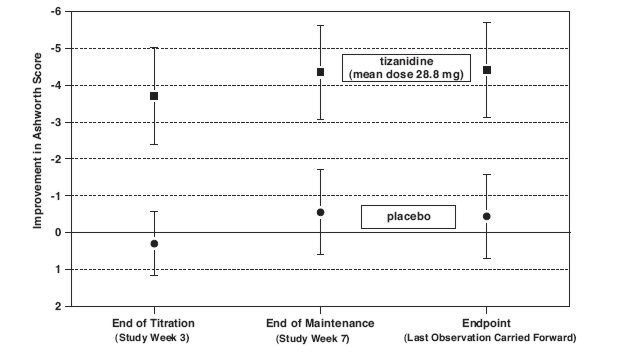
A line chart depicting improvement in Ashworth Score comparing tizanidine (mean dose 28.8 mg) and placebo over three time points: End of Titration (Week 3), End of Maintenance (Week 7), and Endpoint (Last Observation Carried Forward). Tizanidine shows greater improvement with lower scores, indicated by squares, while placebo scores, shown as circles, remain higher with less improvement. Error bars represent variability at each time point.*

* About these descriptions: Image descriptions on this page are generated by automated AI analysis of the product label images from the manufacturer's FDA label submission (SPL). They are provided for reference only and may contain errors or omissions. Always rely on the printed label itself and the official FDA labeling, and consult a pharmacist or healthcare professional with any questions about this product.