Dutasteride Capsule, Liquid Filled
Product Images NDC 68071-3757

View Photos of Packaging, Regulatory Labels, and Product Appearance

Product Visual Gallery

This gallery contains 9 technical images submitted to the FDA as part of the official labeling for Dutasteride (NDC 68071-3757). Unlike standard consumer photos, these assets often include clinical data figures, molecular chemical structures, and official manufacturer packaging layouts.

As provided by Nucare Pharmaceuticals, Inc., these visuals offer a comprehensive scientific overview of the product's physical and chemical identity, aiding pharmacists and researchers in product verification and study.

FDA Label Image

Pdp (68071 3757 6)

Pdp (68071 3757 6)
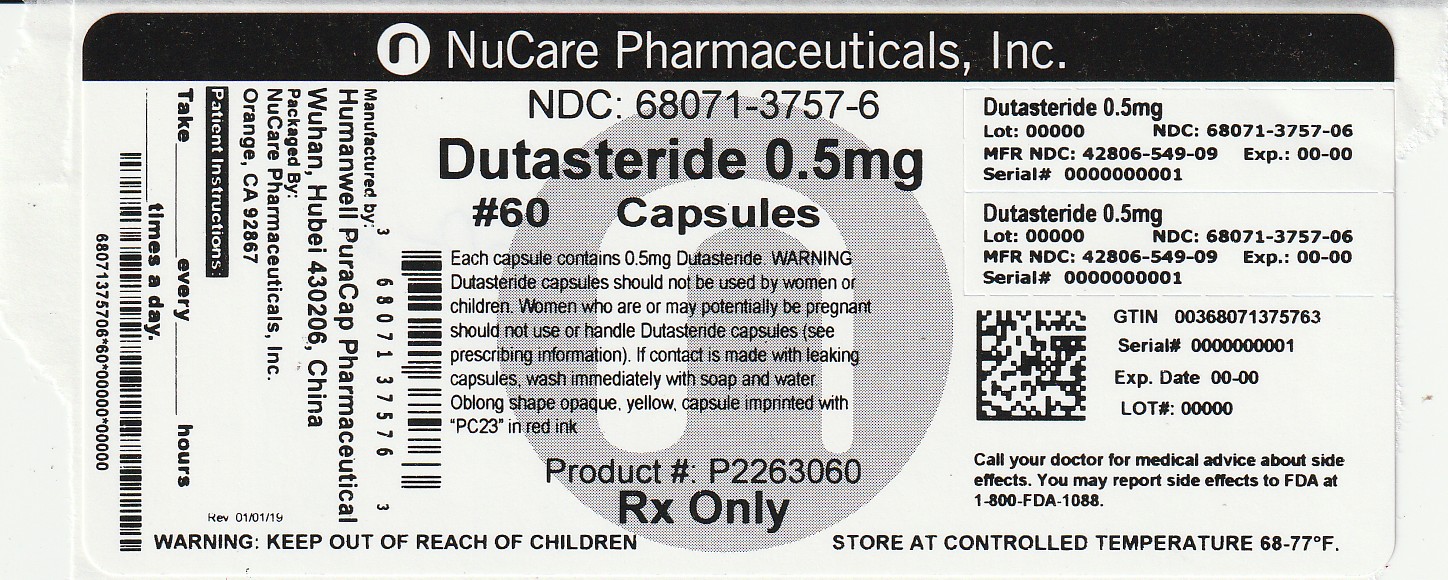
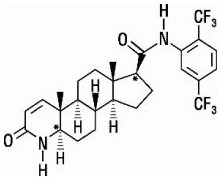
This text appears to contain information about a medication called Dutasteride 0.5mg, including lot numbers, NDC codes, manufacturing details, expiration dates, and serial numbers. The text also includes a warning to keep the medication out of reach of children and instructions to store it at a controlled temperature of 68-77°F. It advises contacting a doctor for medical advice on potential side effects and provides contact information for reporting side effects to the FDA.*
FDA Label Image

Figure-1 (Figure 1)

FDA Label Image

Figure-2 (Figure 2)

Figure-2 (Figure 2)
This text provides data on the percentage of patients who experienced events over months of treatment in two different groups: Placebo Group and Dutasteride Group. It includes the number of events and the number of patients at risk for each group at different time points (0, 6, 12, 18, 24 months). The information can be used to analyze the effectiveness or outcomes of the treatments over time.*
FDA Label Image

Figure-3 (Figure 3)

Figure-3 (Figure 3)
This appears to be a statistical report showing the number of events and patients at risk in both the placebo and dutasteride groups over several months of treatment. The data includes the cumulative number of events and the number of patients at risk at different time points in the study.*
FDA Label Image

Figure-4 (Figure 4)

Figure-4 (Figure 4)
This is a statistical analysis showing the mean percent change from baseline over different months of treatment for placebo and dutasteride groups. The study includes a total number of participants for each group at different time points.*
FDA Label Image

Figure-5 (Figure 5)

Figure-5 (Figure 5)
This text shows the mean change in mL/sec from baseline over various months of treatment for both the placebo and dutasteride groups. The sample sizes for each time point are also provided. The data can be used to evaluate the effectiveness of dutasteride compared to a placebo in terms of this specific outcome measure.*
FDA Label Image

Figure-6 (Figure 6)

Figure-6 (Figure 6)
This text provides information on different treatments, such as Dutasteride + tamsulosin, Dutasteride 0.5 mg, and Tamsulosin 0.4 mg, along with the number of cases for each treatment. The chart also includes the label "Months of Treatment" and specifies the number of cases for each treatment option.*
FDA Label Image

Figure-7 (Figure 7)

Figure-7 (Figure 7)
This text appears to be a table containing information about different treatments indicated by Dutasteride, tamsulosin, and their combination for a certain number of months. The table shows the number of participants (n) in each treatment group for various time points. Each group is separated by the number of months of treatment.*
FDA Label Image

Structural-formula (Image 01)

* These product label images have been analyzed using experimental machine learning. Please verify findings with the primary label text.