Tadalafil Tablet
Product Images NDC 68071-3758

View Photos of Packaging, Regulatory Labels, and Product Appearance

Product Visual Gallery

This gallery contains 10 technical images submitted to the FDA as part of the official labeling for Tadalafil (NDC 68071-3758). Unlike standard consumer photos, these assets often include clinical data figures, molecular chemical structures, and official manufacturer packaging layouts.

As provided by Nucare Pharmaceuticals, Inc., these visuals offer a comprehensive scientific overview of the product's physical and chemical identity, aiding pharmacists and researchers in product verification and study.

FDA Label Image

Pdp (68071 3758 7)

Pdp (68071 3758 7)
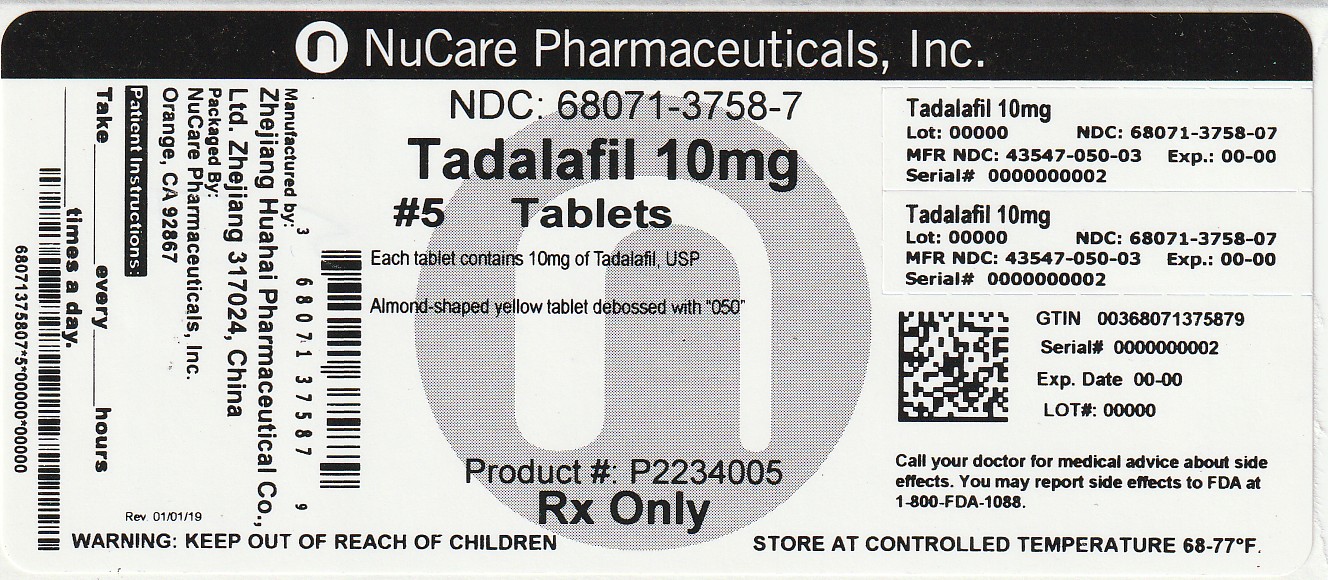
This text contains information about NuCare Pharmaceuticals, including their product with lot number 00000 and expiry date 00-00. It also provides details about Tadalafil 10mg tablets with different lot numbers and serial numbers. It includes a warning to keep the product out of reach of children and store it at a controlled temperature of 68-77°F. The text mentions contacting a doctor for medical advice on side effects and reporting any side effects to the FDA.*
FDA Label Image

F35596a7-figure-01 (F35596a7 Figure 01)

FDA Label Image

F35596a7-figure-02 (F35596a7 Figure 02)

F35596a7-figure-02 (F35596a7 Figure 02)
This is not a readable text.*
FDA Label Image

F35596a7-figure-03 (F35596a7 Figure 03)

F35596a7-figure-03 (F35596a7 Figure 03)
This is a chart showing the standing systolic blood pressure (BP) measured in millimeters of mercury (mmHg) in relation to time. The text also mentions the administration of Tadalafil 20 mg and doxazosin 8 mg.*
FDA Label Image

F35596a7-figure-04 (F35596a7 Figure 04)

F35596a7-figure-04 (F35596a7 Figure 04)
This text appears to contain information related to a study or experiment involving the administration of different medications and their effects on systolic blood pressure at various time points. The study involves the use of tadalafil, doxazosin, and placebos at different dosages and timings. The data presented seems to show the impact of these medications on systolic blood pressure.*
FDA Label Image

F35596a7-figure-05 (F35596a7 Figure 05)

FDA Label Image

F35596a7-figure-06 (F35596a7 Figure 06)

F35596a7-figure-06 (F35596a7 Figure 06)
This text provides information about the change in IPSS Total Score over the course of treatment with Tadalafil tablets 5 mg compared to a placebo. The data shown indicates a statistically significant difference between the two treatment groups (p<0.001). The graph shows the duration of treatment in weeks on the x-axis, with the change from baseline score on the y-axis.*
FDA Label Image

F35596a7-figure-07 (F35596a7 Figure 07)

F35596a7-figure-07 (F35596a7 Figure 07)
This text is not readable.*
FDA Label Image

F35596a7-figure-08 (F35596a7 Figure 08)

F35596a7-figure-08 (F35596a7 Figure 08)
LS Mean Change from Baseline for TadalafilFinasteride and PlaceboFinasteride groups is represented. The Least Squares Treatment Difference between the two groups can be analyzed.*
FDA Label Image

F35596a7-figure-09 (F35596a7 Figure 09)

F35596a7-figure-09 (F35596a7 Figure 09)
This text appears to be a reference to a clinical trial involving Tadalafil tablets. It provides information on the dosage of 5 mg and mentions the comparison with a placebo. Additionally, there is a statistical significance indicated by '*p<0.01'. The graph below shows the duration of treatment in weeks.*

* These product label images have been analyzed using experimental machine learning. Please verify findings with the primary label text.