Finasteride Tablet, Film Coated
Product Images NDC 68071-3785

View Photos of Packaging, Regulatory Labels, and Product Appearance

Product Visual Gallery

This gallery contains 7 technical images submitted to the FDA as part of the official labeling for Finasteride (NDC 68071-3785). Unlike standard consumer photos, these assets often include clinical data figures, molecular chemical structures, and official manufacturer packaging layouts.

As provided by Nucare Pharmaceuticals, Inc., these visuals offer a comprehensive scientific overview of the product's physical and chemical identity, aiding pharmacists and researchers in product verification and study.

FDA Label Image

Pdp (68071 3785 8)

Pdp (68071 3785 8)
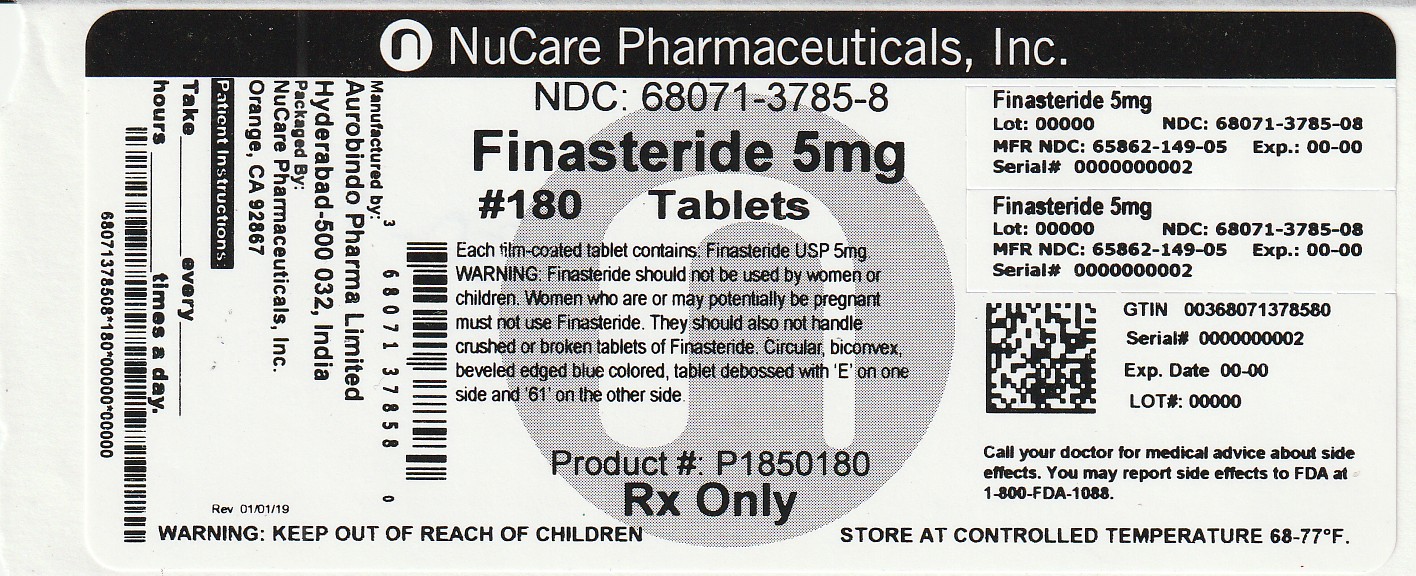
This text is product information for Finasteride 5mg tablets from Care Pharmaceuticals. It includes Lot numbers, NDC information, expiration dates, and serial numbers for the medication. Additionally, there is a warning to keep the product out of reach of children and to store it at a controlled temperature between 68-77°F. Consumers are advised to consult their doctor for medical advice and to report any side effects to the FDA.*
FDA Label Image

Figure 1 Symptom Score In A Long-term Efficacy And Safety Study (Finasteride Fig1)

Figure 1 Symptom Score In A Long-term Efficacy And Safety Study (Finasteride Fig1)
This text shows the mean change from baseline plus 1 standard error in a long-term efficacy and safety study comparing a placebo group with a finasteride group. The study evaluated symptom scores over a 4-year period. The data provided in the text includes values for each group at baseline, year 1, year 2, year 3, and year 4.*
FDA Label Image

Figure 2 Percent Of Patients Having Surgery For Bph, Including Turp (Finasteride Fig2)

Figure 2 Percent Of Patients Having Surgery For Bph, Including Turp (Finasteride Fig2)
This text appears to provide statistical information on the percent of patients having surgery for benign prostatic hyperplasia (BPH), specifically comparing the impact of Finasteride vs. Placebo over a certain observation time. The data includes the percentage of patients having surgery over time, the number of events at different time points, the number at risk per year in both the Placebo and Finasteride groups. The graph represented in Figure 2 illustrates the change in the percentage of patients having surgery for BPH, including Transurethral Resection of the Prostate (TURP), over a span of 32 months. The information indicates that the surgery rate for patients in the Finasteride group is lower compared to those in the Placebo group.*
FDA Label Image

Figure3 (Finasteride Fig3)

Figure3 (Finasteride Fig3)
This data shows the percentage of patients developing acute urinary retention over time, comparing a placebo group to a group taking Finasteride. The graph shows an increase in events over the observation period for both groups, with the Finasteride group having fewer events than the placebo group. The lines intersect at different points, showcasing the changes in the incidence of acute urinary retention over time.*
FDA Label Image

Figure4 (Finasteride Fig4)

Figure4 (Finasteride Fig4)
This information presents the mean percent change from baseline with 1 standard error for Prostate Volume in a Long-Term Efficacy and Safety Study. The data shows the prostate volume measurements over a period of four years for subjects receiving either Placebo or Finasteride treatment. The values indicate a decrease in prostate volume over the years for both treatment groups, with Finasteride showing a more consistent reduction compared to Placebo.*
FDA Label Image

Figure5 (Finasteride Fig5)

Figure5 (Finasteride Fig5)
This graph shows the cumulative incidence of a 4-point rise in AUA Symptom Score by treatment group over several years from randomization. It provides a visual representation of the percentage of individuals experiencing this specific increase in symptom score over time in different treatment groups.*
FDA Label Image

Chemical Structure (Finasteride Str)

* These product label images have been analyzed using experimental machine learning. Please verify findings with the primary label text.