Anastrozole Tablet
Product Images NDC 68071-3838

View Photos of Packaging, Regulatory Labels, and Product Appearance

Product Visual Gallery

This gallery contains 8 technical images submitted to the FDA as part of the official labeling for Anastrozole (NDC 68071-3838). Unlike standard consumer photos, these assets often include clinical data figures, molecular chemical structures, and official manufacturer packaging layouts.

As provided by Nucare Pharmaceuticals,inc., these visuals offer a comprehensive scientific overview of the product's physical and chemical identity, aiding pharmacists and researchers in product verification and study.

FDA Label Image

Pdp (68071 3838 9)

Pdp (68071 3838 9)
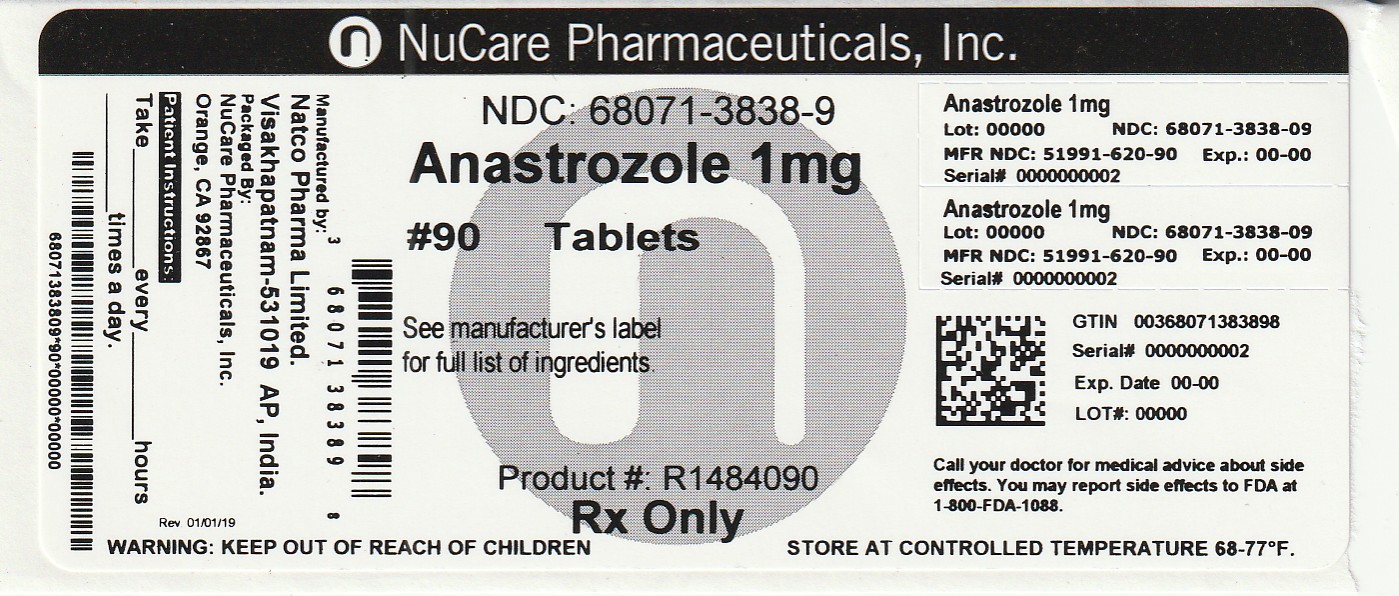
This is a description of a pharmaceutical product labeled as Anastrozole 1mg, manufactured by NuCare Pharmaceuticals, Inc. The product details include Lot number, NDC number, manufacturer's information, expiration date, GTIN, and instructions to contact a doctor for medical advice. It also includes a warning to keep the product out of reach of children and to store it at a controlled temperature of 68-77°F.*
FDA Label Image

Chemical Structure (Anastrozole 01)

FDA Label Image

Figure 1 (Anastrozole 02)

Figure 1 (Anastrozole 02)
This data table shows the disease-free survival in months for patients in a study comparing anastrozole and tamoxifen treatments. The graph plots the proportion of patients alive and disease-free over a span of 90 months. The number of patients at risk for each treatment group is provided at various time points.*
FDA Label Image

Figure 2 (Anastrozole 03)

Figure 2 (Anastrozole 03)
This is a data table showing the disease-free survival in months for patients receiving anastrozole and tamoxifen in a randomized treatment. The chart displays the proportion of patients alive and disease-free over time, with data points at 0, 6, 12, 18, 24, 30, 36, 42, 48, 54, 60, 66, 72, 78, 84, and 90 months. The number of patients at risk is also provided for each treatment group at different time points.*
FDA Label Image

Figure 3 (Anastrozole 04)

FDA Label Image

Figure 4 (Anastrozole 05)

FDA Label Image

Figure 5 (Anastrozole 06)

Figure 5 (Anastrozole 06)
The provided text appears to be a table showing the time to progression in months for patients receiving randomized treatment with anastrozole and tamoxifen. The table allows for the comparison of progression rates between the two treatment groups over the specified time periods.*
FDA Label Image

Figure 6 (Anastrozole 07)

Figure 6 (Anastrozole 07)
The text shows a graph displaying the progression of randomized treatment between Anastrozole and Tamoxifen over the course of 40 months. It indicates the number of subjects at risk for each month of the study. The chart visually represents how the proportion of subjects is not progressing uniformly over time.*

* These product label images have been analyzed using experimental machine learning. Please verify findings with the primary label text.