Dutasteride Capsule, Liquid Filled
Product Images NDC 68071-3857

View Photos of Packaging, Regulatory Labels, and Product Appearance

Product Visual Gallery

This gallery contains 9 technical images submitted to the FDA as part of the official labeling for Dutasteride (NDC 68071-3857). Unlike standard consumer photos, these assets often include clinical data figures, molecular chemical structures, and official manufacturer packaging layouts.

As provided by Nucare Pharmaceuticals, Inc., these visuals offer a comprehensive scientific overview of the product's physical and chemical identity, aiding pharmacists and researchers in product verification and study.

FDA Label Image

Pdp (68071 3857 9)

Pdp (68071 3857 9)
NuCare Pharmaceuticals, Inc. label for Dutasteride 0.5 mg capsules, liquid filled, oral use. The label states a package count of 90 capsules with product number R1750090 and Rx only. It includes barcode, lot number placeholder, expiration placeholder, and storage instructions to keep at controlled temperature 68-77°F. Manufactured by Humanwell PuraCap Pharmaceutical in China.*
FDA Label Image

Figure-1 (Figure 1)

Figure-1 (Figure 1)
A line chart showing the mean change from baseline in AUA-SI over 24 months of treatment for Dutasteride and placebo groups. The x-axis represents months of treatment (0 to 24), and the y-axis shows mean change from baseline in AUA-SI. The Dutasteride group (open circles) shows a larger decrease over time compared to the placebo group (black squares). Sample sizes are indicated for each time point.*
FDA Label Image

Figure-2 (Figure 2)

Figure-2 (Figure 2)
A line graph showing percent of patients on the y-axis versus months of treatment up to 24 months on the x-axis, comparing placebo and dutasteride groups. The plot includes cumulative number of events and number of patients at risk for both groups at multiple time points during treatment.*
FDA Label Image

Figure-3 (Figure 3)

Figure-3 (Figure 3)
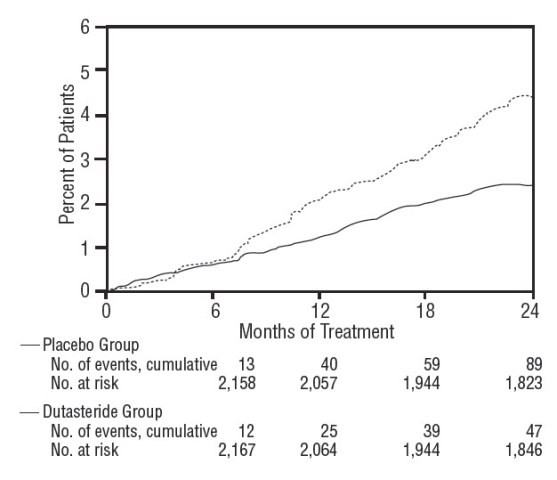
A line graph showing the cumulative percentage of patients over 24 months of treatment in two groups: Placebo and Dutasteride. The vertical axis represents percent of patients (0-6%), and the horizontal axis is months of treatment (0-24). It includes cumulative event counts and numbers at risk for each group at various time points.*
FDA Label Image

Figure-4 (Figure 4)

Figure-4 (Figure 4)
A bar graph showing mean percent change from baseline over months of treatment (0, 1, 3, 6, 12, 24) comparing placebo (black bars) and Dutasteride (white bars). Dutasteride shows a larger negative percent change compared to placebo at each time point. Sample sizes for placebo and Dutasteride groups are indicated below each month.*
FDA Label Image

Figure-5 (Figure 5)

Figure-5 (Figure 5)
A line graph showing mean change from baseline (mL/sec) over 24 months of treatment comparing Dutasteride and placebo. The x-axis represents months of treatment from 0 to 24, and the y-axis represents mean change from baseline in mL/sec from 0 to 2. Dutasteride shows a greater increase over time compared to the placebo group.*
FDA Label Image

Figure-6 (Figure 6)

Figure-6 (Figure 6)
A line graph illustrating the mean change from baseline in IPSS over 48 months of treatment for three groups: Dutasteride + tamsulosin, Dutasteride 0.5 mg, and Tamsulosin 0.4 mg. The x-axis represents months of treatment and the y-axis shows change from baseline, with data points for each treatment group.*
FDA Label Image

Figure-7 (Figure 7)

Figure-7 (Figure 7)
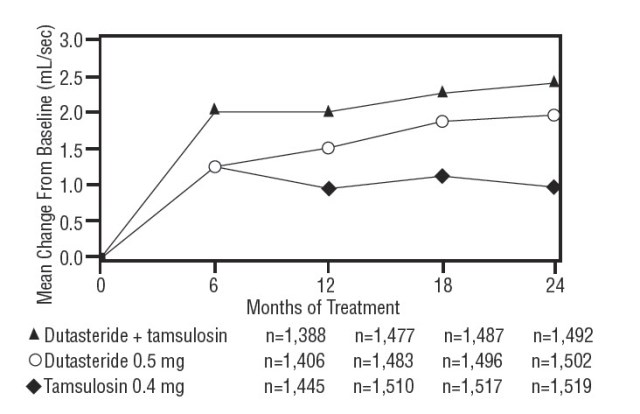
A line graph showing mean change from baseline in mL/sec over 24 months of treatment for three groups: Dutasteride plus tamsulosin, Dutasteride 0.5 mg, and Tamsulosin 0.4 mg. The x-axis is labeled 'Months of Treatment' (0 to 24), and the y-axis is labeled 'Mean Change From Baseline (mL/sec)' (0 to 3.0). Sample sizes for each group at 6, 12, 18, and 24 months are shown below the legend.*
FDA Label Image

Structural-formula (Image 01)

Structural-formula (Image 01)
Chemical structure of Dutasteride, showing its steroidal backbone with trifluoromethyl-substituted aromatic ring and multiple hydrogen, oxygen, and nitrogen atoms as part of the molecule.*

* About these descriptions: Image descriptions on this page are generated by automated AI analysis of the product label images from the manufacturer's FDA label submission (SPL). They are provided for reference only and may contain errors or omissions. Always rely on the printed label itself and the official FDA labeling, and consult a pharmacist or healthcare professional with any questions about this product.