Carvedilol Tablet, Film Coated
Product Images NDC 68071-3970

View Photos of Packaging, Regulatory Labels, and Product Appearance

Product Visual Gallery

This gallery contains 6 technical images submitted to the FDA as part of the official labeling for Carvedilol (NDC 68071-3970). Unlike standard consumer photos, these assets often include clinical data figures, molecular chemical structures, and official manufacturer packaging layouts.

As provided by Nucare Pharmaceuticals, Inc., these visuals offer a comprehensive scientific overview of the product's physical and chemical identity, aiding pharmacists and researchers in product verification and study.

FDA Label Image

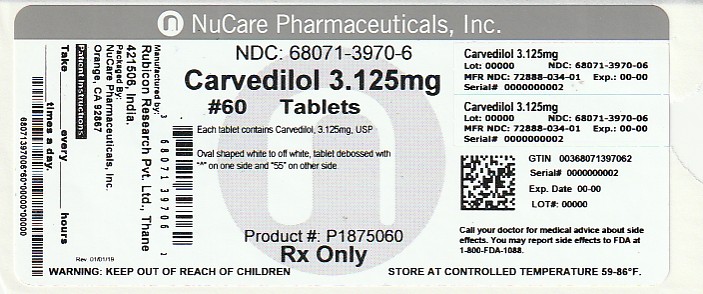
Pdp (68071 3970 6)

Pdp (68071 3970 6)
CARVEDILOL 3.125 mg film-coated tablets from NuCare Pharmaceuticals, Inc. The label indicates package size of 60 tablets with each tablet containing 3.125 mg of Carvedilol. Tablets are oval-shaped, white, film-coated and marked with '**' on one side and '55' on the other. Includes NDC 68071-3970-6, lot and expiration placeholders, and storage instructions to keep at controlled temperature 59-86°F. Rx only.*
FDA Label Image

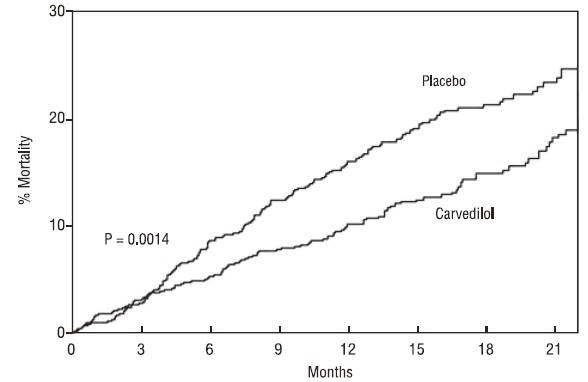
Figure 1. Survival Analysis For Copernicus (intent-to-treat) (Carvedilol Tab Usp Figure1)

Figure 1. Survival Analysis For Copernicus (intent-to-treat) (Carvedilol Tab Usp Figure1)
A line graph showing percentage mortality over a span of 21 months. Two lines compare mortality rates between a placebo group and a carvedilol group, with the placebo group showing higher mortality than the carvedilol group. A p-value of 0.0014 indicates statistical comparison between the groups.*
FDA Label Image

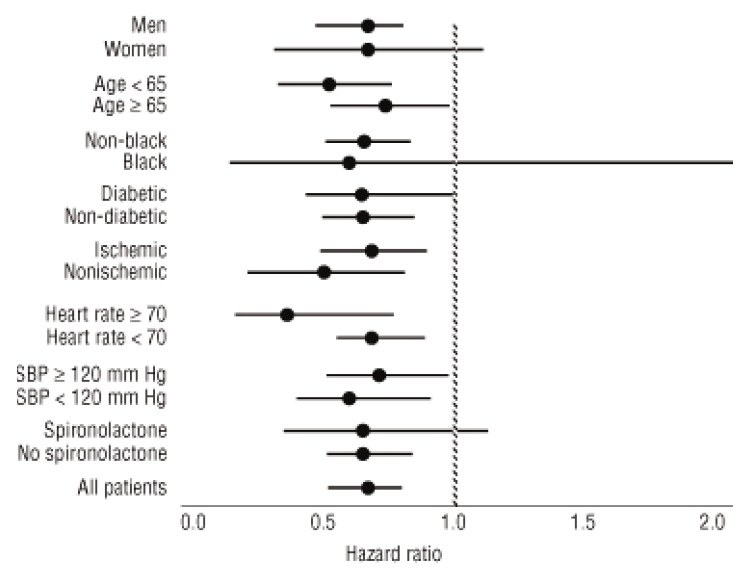
Figure 2. Effects On Mortality For Subgroups In Copernicus (Carvedilol Tab Usp Figure2)

Figure 2. Effects On Mortality For Subgroups In Copernicus (Carvedilol Tab Usp Figure2)
A hazard ratio forest plot showing comparative risk across different subgroups such as gender, age, race, diabetic status, ischemic condition, heart rate, systolic blood pressure, and spironolactone use, with points and confidence intervals plotted along a horizontal axis ranging approximately from 0.0 to 2.0.*
FDA Label Image

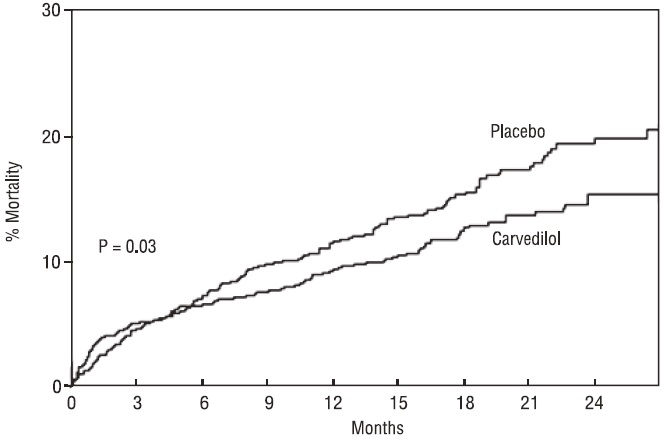
Figure 3. Survival Analysis For Capricorn (intent-to-treat) (Carvedilol Tab Usp Figure3)

Figure 3. Survival Analysis For Capricorn (intent-to-treat) (Carvedilol Tab Usp Figure3)
A line graph comparing percentage mortality over 24 months between Carvedilol and Placebo groups. The x-axis represents months, and the y-axis represents % mortality. The graph shows mortality trends for both groups with a statistical significance indicated (P = 0.03). Placebo has higher mortality compared to Carvedilol over time.*
FDA Label Image

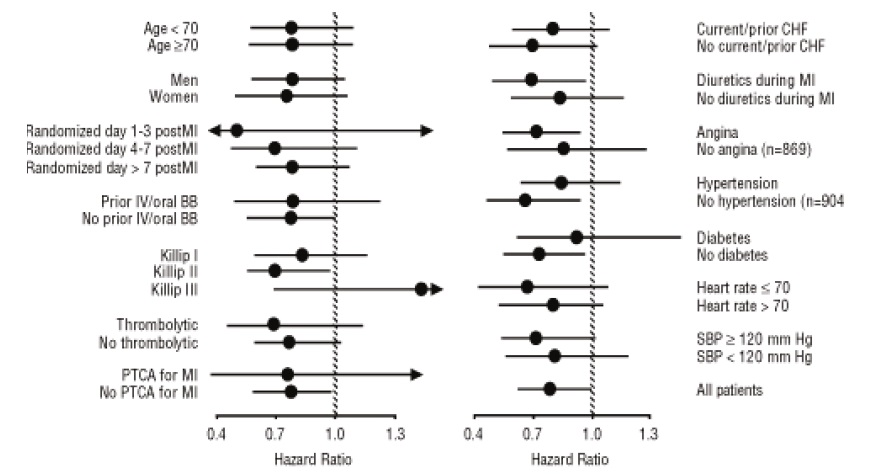
Figure 4. Effects On Mortality For Subgroups In Capricorn (Carvedilol Tab Usp Figure4)

Figure 4. Effects On Mortality For Subgroups In Capricorn (Carvedilol Tab Usp Figure4)
A hazard ratio forest plot showing subgroup analyses with variables including age, sex, timing post-myocardial infarction, prior oral beta-blocker use, Killip class, thrombolytic use, PTCA for MI, CHF status, diuretic use during MI, angina, hypertension, diabetes, heart rate, and systolic blood pressure. The plot depicts hazard ratios with confidence intervals for each subgroup, comparing treatment effects across diverse patient characteristics.*
FDA Label Image

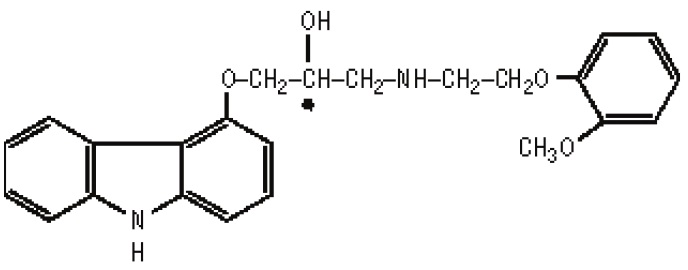
Carvedilol Chemical Structure (Carvedilol Tab Usp Structure)

Carvedilol Chemical Structure (Carvedilol Tab Usp Structure)
Chemical structure diagram of carvedilol, showing its molecular composition and arrangement of atoms as presented in the image.*

* About these descriptions: Image descriptions on this page are generated by automated AI analysis of the product label images from the manufacturer's FDA label submission (SPL). They are provided for reference only and may contain errors or omissions. Always rely on the printed label itself and the official FDA labeling, and consult a pharmacist or healthcare professional with any questions about this product.