Sildenafil Tablet, Film Coated
Product Images NDC 68071-3978

View Photos of Packaging, Regulatory Labels, and Product Appearance

Product Visual Gallery

This gallery contains 10 technical images submitted to the FDA as part of the official labeling for Sildenafil (NDC 68071-3978). Unlike standard consumer photos, these assets often include clinical data figures, molecular chemical structures, and official manufacturer packaging layouts.

As provided by Nucare Pharmaceuticals, Inc., these visuals offer a comprehensive scientific overview of the product's physical and chemical identity, aiding pharmacists and researchers in product verification and study.

FDA Label Image

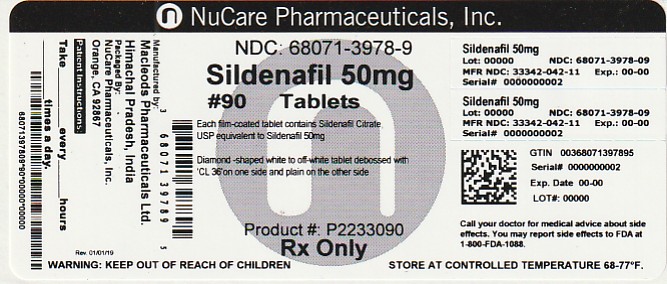
Pdp (68071 3978 9)

Pdp (68071 3978 9)
Sildenafil 50 mg film-coated tablets by NuCare Pharmaceuticals, Inc., packaged in a #90 count bottle. The label includes drug identification, dosage strength, and warnings. Tablets are diamond-shaped, white to off-white with debossed markings. The packaging instructs storage between 68-77°F and emphasizes prescription-only use.*
FDA Label Image

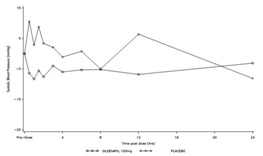
Fig-1 (Sildenafil Fig 1)

Fig-1 (Sildenafil Fig 1)
A line chart comparing the mean plasma concentration of Sildenafil over time between Sildenafil and placebo groups. The x-axis represents time post-dose in hours, and the y-axis shows mean plasma concentration in ng/mL. Two lines depict trends for Sildenafil and placebo from 0 to 24 hours post-dose.*
FDA Label Image

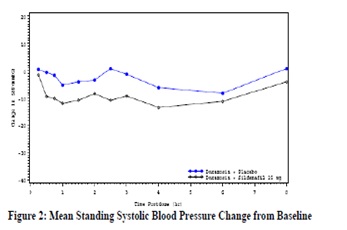
Fig-2 (Sildenafil Fig 2)

Fig-2 (Sildenafil Fig 2)
A line graph titled 'Mean Standing Systolic Blood Pressure Change from Baseline' depicting changes in systolic blood pressure over time postdose. The graph compares data between two groups: placebo and sildenafil 50 mg, showing trends for each group throughout the study period.*
FDA Label Image

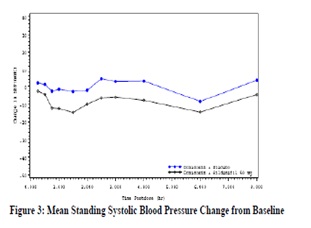
Fig-3 (Sildenafil Fig 3)

Fig-3 (Sildenafil Fig 3)
A line graph titled 'Figure 3: Mean Standing Systolic Blood Pressure Change from Baseline.' It displays two lines comparing systolic blood pressure changes over time points, with one line in blue showing Sildenafil 50 mg and another in black representing a placebo.*
FDA Label Image

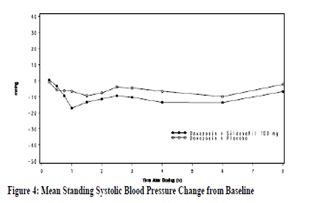
Fig-4 (Sildenafil Fig 4)

Fig-4 (Sildenafil Fig 4)
A line graph titled 'Mean Standing Systolic Blood Pressure Change from Baseline' showing blood pressure changes over time with three different groups: Deserpidine, Sildenafil 100 mg, and Placebo. The x-axis represents time after dosing in hours, and the y-axis shows systolic blood pressure change in mmHg.*
FDA Label Image

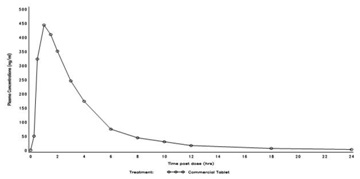
Fig-5 (Sildenafil Fig 5)

Fig-5 (Sildenafil Fig 5)
A line graph comparing plasma concentration (ng/mL) over time post-dose (hours) between Sildenafil commercial tablets and a test treatment. The graph shows plasma levels peaking around 1 hour and then gradually decreasing over 24 hours for both treatments.*
FDA Label Image

Sildenafil-fig-6-part-1.jpg (Sildenafil Fig 6 Part 1)

Sildenafil-fig-6-part-1.jpg (Sildenafil Fig 6 Part 1)
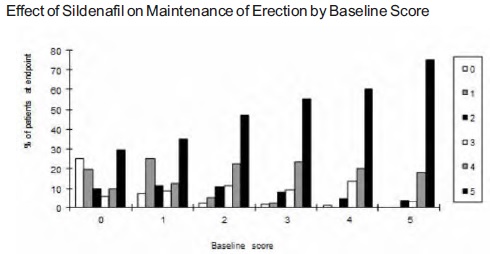
A bar chart titled 'Effect of Sildenafil on Maintenance of Erection by Baseline Score' showing the number of patients at endpoint on the vertical axis and baseline scores from 0 to 5 on the horizontal axis. Multiple bars represent different categories for each baseline score, with higher baseline scores generally associated with more patients at endpoint.*
FDA Label Image

Sildenafil-fig-6-part-2.jpg (Sildenafil Fig 6 Part 2)

Sildenafil-fig-6-part-2.jpg (Sildenafil Fig 6 Part 2)
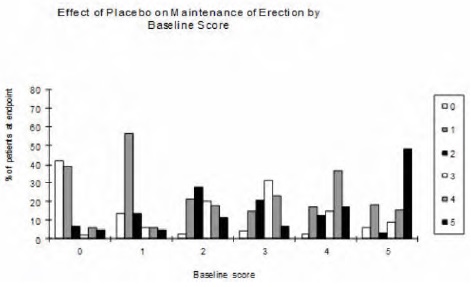
A bar graph titled 'Effect of Placebo on Maintenance of Erection by Baseline Score.' The x-axis represents baseline scores from 0 to 5, and the y-axis shows the percentage of patients at endpoint, ranging from 0 to 80%. Multiple bars for each baseline score indicate different scores from 0 to 5, showing distribution of outcomes for patients under placebo conditions.*
FDA Label Image

Fig-7 (Sildenafil Fig 7)

Fig-7 (Sildenafil Fig 7)
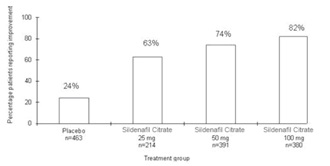
A bar chart comparing the percentage of patients reporting improvement across four treatment groups: Placebo, Sildenafil Citrate 25 mg, Sildenafil Citrate 50 mg, and Sildenafil Citrate 100 mg. The y-axis represents the percentage of patients reporting improvement, ranging from 0% to 100%.*
FDA Label Image

Sildenafil-structure.jpg (Sildenafil Structure)

Sildenafil-structure.jpg (Sildenafil Structure)
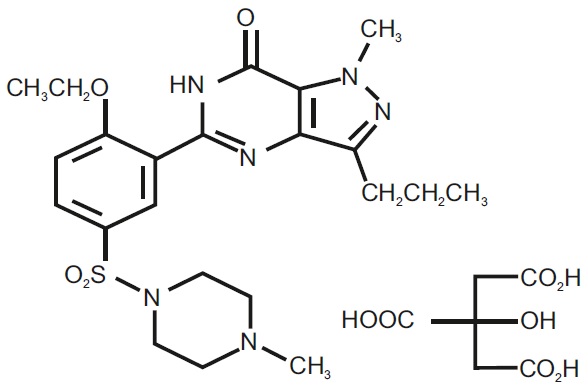
Chemical structure diagram of sildenafil, showing its molecular composition including aromatic rings, sulfonamide group, and other characteristic chemical groups.*

* About these descriptions: Image descriptions on this page are generated by automated AI analysis of the product label images from the manufacturer's FDA label submission (SPL). They are provided for reference only and may contain errors or omissions. Always rely on the printed label itself and the official FDA labeling, and consult a pharmacist or healthcare professional with any questions about this product.