Product Images Tamsulosin Hydrochloride
View Photos of Packaging, Labels & Appearance
Product Label Images
The following 7 images provide visual information about the product associated with Tamsulosin Hydrochloride NDC 68071-4443 by Nucare Pharmaceuticals,inc., such as packaging, labeling, and the appearance of the drug itself. This resource could be helpful for medical professionals, pharmacists, and patients seeking to verify medication information and ensure they have the correct product.
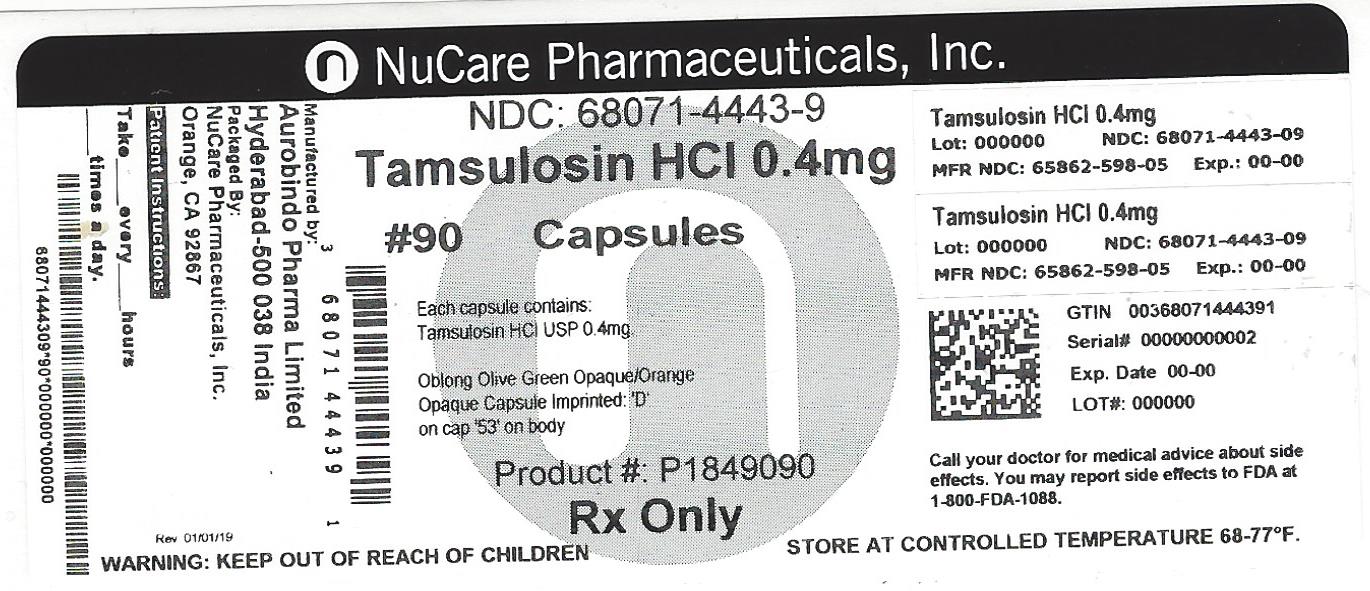
NuCare Pharmaceuticals, Inc. presents Tamsulosin HCI 0.4mg capsules in a lot of 90 units, presented in an olive green opaque/orange oblong capsule imprinted with "D", "Exp. Date", and "Lot#: 000000". Each capsule contains TansosinHC USP 0.4mg with GTIN 0036807144391 and a Serial# 00000000002. The Manufacturer NDC is 65862-598-05, and the product is RX only, with a warning to keep out of reach of children and stored at a controlled temperature of 68-77°F. Contact the doctor for medical advice about side effects or report them to the FDA at 1-800-FDA-1088.*
The image shows a graph representing the mean change from baseline in Total AUA Symptom Score in a study with two treatment options: an 0.08mg dose of a certain substance and a placebo. The x-axis indicates the duration of the treatment in weeks and the y-axis shows the mean change score from 0 to 35. There are multiple data points for each treatment option, ranging from week 0 to week 13, and the last data point shows the LOCF (last observation carried forward) value.*
This is a figure displaying the mean change from baseline in the Total American Urological Association (AUA) Symptom Score on a scale of 0 to 35, in Study 2. The graph shows the value for different treatments including O=0O—0-08mg LNt 0.4mg, 3 Placebo with the duration of treatment in weeks being displayed on the X-axis. It also shows the number of participants for each treatment option.*
The image shows a graph titled "Mean Increase in Peak Urine Flow Rate (in L/Sec) Study 1". The graph displays the peak urine flow rate in mL/sec for different treatments, including two different dosages (0.08mg and 0.4mg) and a placebo group. The mean change in urine flow rate is shown on the y-axis, and the duration of treatment in weeks is shown on the x-axis. The graph includes four data points for each treatment group, with sample sizes ranging from 617 to 755.*
* The product label images have been analyzed using a combination of traditional computing and machine learning techniques. It should be noted that the descriptions provided may not be entirely accurate as they are experimental in nature. Use the information in this page at your own discretion and risk.