Losartan Potassium Tablet, Film Coated
Product Images NDC 68071-4943

6 FDA label images from Nucare Pharmaceuticals,inc. · Packaging, Regulatory Labels, and Product Appearance

Product Visual Gallery

This gallery contains 6 technical images submitted to the FDA as part of the official labeling for Losartan Potassium (NDC 68071-4943). Unlike standard consumer photos, these assets often include clinical data figures, molecular chemical structures, and official manufacturer packaging layouts.

As provided by Nucare Pharmaceuticals,inc., these visuals offer a comprehensive scientific overview of the product's physical and chemical identity, aiding pharmacists and researchers in product verification and study.

FDA Label Image

68071 4943 9

68071 4943 9
Label for Losartan Potassium 50mg tablets distributed by Aurobindo Pharma USA, Inc. East, packaged by NuCare Pharmaceuticals, Inc., 90 count. The label includes warnings to keep out of reach of children, storage instructions at controlled temperature 59-86°F, and directions to see manufacturer's label for full ingredient list. It is Rx only, with visible barcodes and lot, expiration information.*
FDA Label Image

Figure1 (Losartan Fig1)

Figure1 (Losartan Fig1)
A line graph comparing the percentage of patients with a primary endpoint over study months for Losartan Potassium and Atenolol. The x-axis represents study months (0 to 66), and the y-axis shows the percentage of patients (0 to 16). Losartan Potassium is shown with a solid line, and Atenolol with a dotted line. The graph notes an adjusted risk reduction of 13% with a p-value of 0.021.*
FDA Label Image

Figure2 (Losartan Fig2)

Figure2 (Losartan Fig2)
A line graph comparing the percentage of patients with fatal or non-fatal stroke over a study period of 66 months between Atenolol and Losartan Potassium. The graph shows lower stroke percentages for Losartan Potassium, with an adjusted risk reduction of 25% (p=0.001). The x-axis represents study months, and the y-axis shows the percentage of patients experiencing strokes.*
FDA Label Image

Figure 3 (Losartan Fig3)

Figure 3 (Losartan Fig3)
A figure titled 'Primary Endpoint Events within Demographic Subgroups' presenting hazard ratios with 95% confidence intervals comparing Losartan Potassium and Atenolol. The chart includes subgroups by age, gender, race, isolated systolic hypertension (ISH), diabetes, and history of cardiovascular disease (CVD), showing event rates (%) for primary composite endpoints and stroke outcomes (fatal/non-fatal). The graph visually indicates whether outcomes favor Losartan Potassium or Atenolol within these groups.*
FDA Label Image

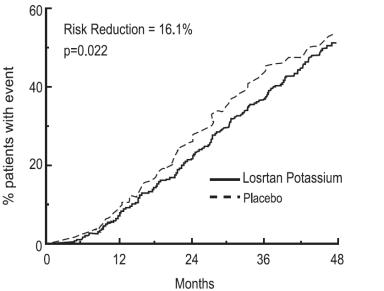
Figure-4 (Losartan Fig4)

Figure-4 (Losartan Fig4)
A line graph comparing the percentage of patients with events over 48 months for Losartan Potassium versus placebo. The solid line represents Losartan Potassium, while the dashed line represents placebo, showing a risk reduction of 16.1% with a p-value of 0.022.*
FDA Label Image

Chemical Structure (Losartan Str)

Chemical Structure (Losartan Str)
Chemical structure of Losartan Potassium, depicting its molecular framework including the tetrazole, biphenyl, and imidazole rings along with the potassium ion (K+).*

* About these descriptions: Image descriptions on this page are generated by automated AI analysis of the product label images from the manufacturer's FDA label submission (SPL). They are provided for reference only and may contain errors or omissions. Always rely on the printed label itself and the official FDA labeling, and consult a pharmacist or healthcare professional with any questions about this product.