Atorvastatin Calcium Tablet, Film Coated
Product Images NDC 68071-4962

5 FDA label images from Nucare Pharmaceuticals,inc. · Packaging, Regulatory Labels, and Product Appearance

Product Visual Gallery

This gallery contains 5 technical images submitted to the FDA as part of the official labeling for Atorvastatin Calcium (NDC 68071-4962). Unlike standard consumer photos, these assets often include clinical data figures, molecular chemical structures, and official manufacturer packaging layouts.

As provided by Nucare Pharmaceuticals,inc., these visuals offer a comprehensive scientific overview of the product's physical and chemical identity, aiding pharmacists and researchers in product verification and study.

FDA Label Image

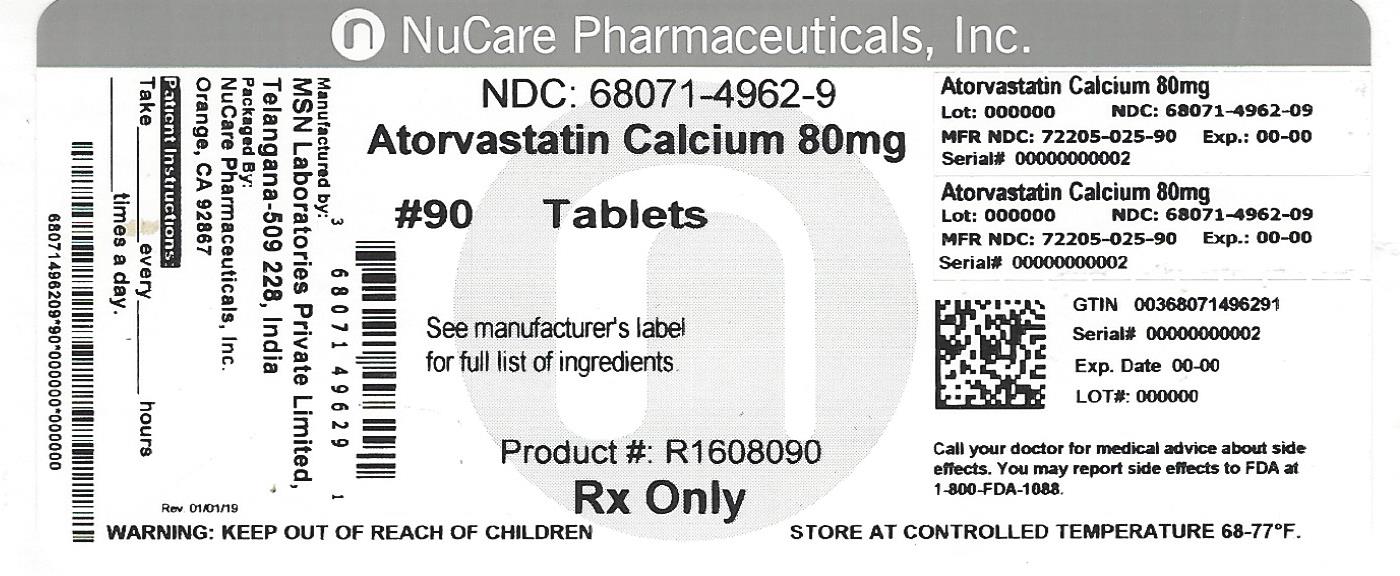
Pdp (68071 4962 9)

Pdp (68071 4962 9)
Label for Atorvastatin Calcium 80 mg tablets, 90 count, from NuCare Pharmaceuticals, Inc. The label includes the NDC number 68071-4962-9 and states 'Rx Only'. It instructs to see the manufacturer's label for a full list of ingredients and includes warnings to keep out of reach of children and to store at controlled temperatures of 68-77°F.*
FDA Label Image

Figure-01 (Atorvastatin Figure 01)

Figure-01 (Atorvastatin Figure 01)
A line graph comparing the cumulative incidence percentage over years for Atorvastatin versus Placebo. The graph shows Atorvastatin with a lower cumulative incidence than Placebo across approximately 3.5 years, with a hazard ratio (HR) of 0.64 (0.50-0.83) and p-value of 0.0005 indicated on the chart.*
FDA Label Image

Figure-02 (Atorvastatin Figure 02)

Figure-02 (Atorvastatin Figure 02)
A line graph showing the cumulative hazard percentage over time (up to 5 years) comparing Placebo (dashed line) and Atorvastatin (solid line). The y-axis represents cumulative hazard (%), and the x-axis represents time to first primary endpoint through four years of follow-up (years). The graph includes a hazard ratio (HR) of 0.63 with confidence interval (0.48-0.83) and a p-value of 0.001.*
FDA Label Image

Figure-03 (Atorvastatin Figure 03)

Figure-03 (Atorvastatin Figure 03)
A line graph comparing the percentage of subjects experiencing a major cardiovascular event over five years between Atorvastatin 10 mg and Atorvastatin 80 mg dosages. The x-axis represents years to first major cardiovascular endpoint, and the y-axis shows the percentage of subjects experiencing the event. The 10 mg dose is depicted with a dashed line and the 80 mg dose with a solid line, showing fewer events with the 80 mg dose.*
FDA Label Image

Structure (Atorvastatin Structure)

Structure (Atorvastatin Structure)
Chemical structure diagram of atorvastatin calcium including its calcium ion and hydration details. The structure shows the molecular arrangement consistent with atorvastatin calcium hydrate form.*

* About these descriptions: Image descriptions on this page are generated by automated AI analysis of the product label images from the manufacturer's FDA label submission (SPL). They are provided for reference only and may contain errors or omissions. Always rely on the printed label itself and the official FDA labeling, and consult a pharmacist or healthcare professional with any questions about this product.