Product Images Tadalafil

View Photos of Packaging, Labels & Appearance

Product Label Images

The following 10 images provide visual information about the product associated with Tadalafil NDC 68071-5202 by Nucare Pharmaceuticals,inc., such as packaging, labeling, and the appearance of the drug itself. This resource could be helpful for medical professionals, pharmacists, and patients seeking to verify medication information and ensure they have the correct product.

PDP - 68071 5202 3

PDP - 68071 5202 3

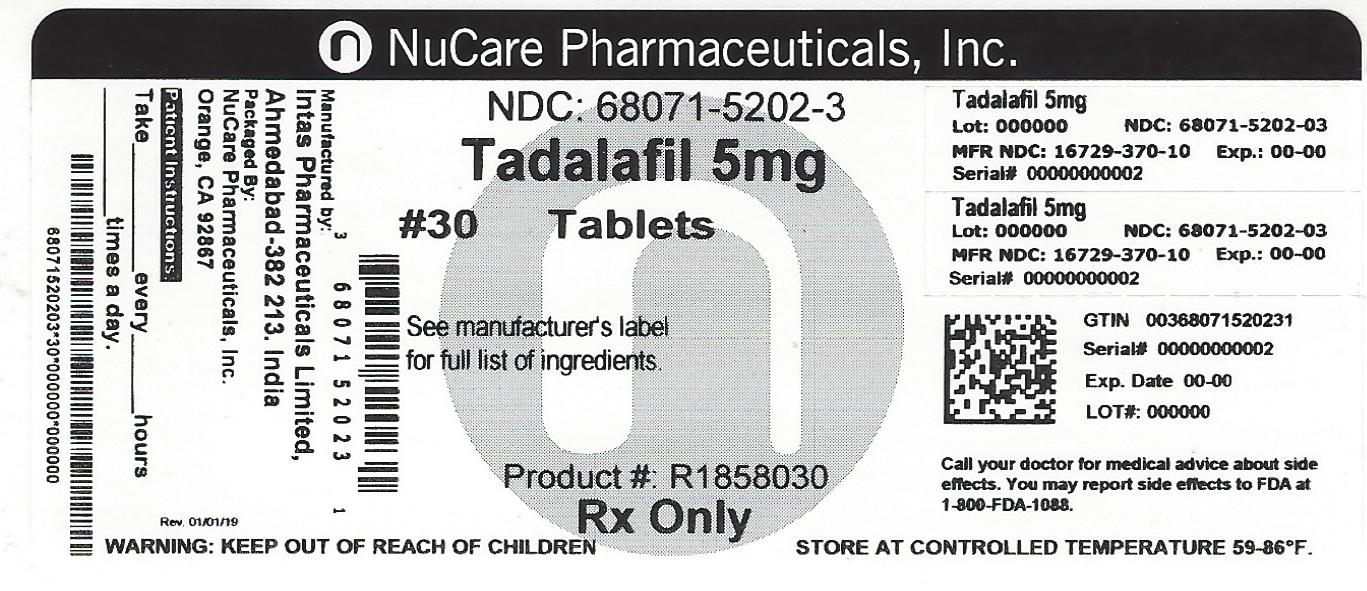
The text appears to be a product label for Tadalafil from NuCare Pharmaceuticals, Inc. It includes information such as the lot number, serial number, and expiration date, as well as instructions on storage and a warning to keep the product out of reach from children.*

Figure - tadalafil figure1

Figure - tadalafil figure1

This appears to be a table showing the difference in blood pressure in mmHg between Tadalafil and Placebo for standing and supine positions. It also shows the time in hours.*

Figure - tadalafil figure2

Figure - tadalafil figure2

This text seems to represent tabular data with some numbers and symbols, including some currency symbols, letters, and some other characters that could not be recognized by . Without context or further information, it is not possible to provide a meaningful description or interpretation of the text.*

Figure - tadalafil figure3

Figure - tadalafil figure3

The text includes a chart with information about the impact of taking tadalafil and doxazosin on systolic blood pressure at different times after administration. No further information is available.*

Figure - tadalafil figure4

Figure - tadalafil figure4

This is a graph showing Plasma Tadalafil Concentration (ug/L) at different times (in hours) after the administration of tadalafil in different doses (single 20-mg dose, single 5-mg dose, and once daily 5-mg dose for 5 consecutive days). The concentration is plotted on the y-axis, and time is plotted on the x-axis. The graph indicates that tadalafil concentration increases rapidly after administration and reaches a peak concentration in the blood within a few hours, and then gradually decreases over time.*

Figure 5 - tadalafil figure5

Figure 5 - tadalafil figure5

The text provides information about the change in IPSS (International Prostate Symptom Score) total score during treatment with tadalafils and placebo. The graph shows that tadalafils mg resulted in a statistically significant improvement in IPSS total score compared to placebo (p<0.01) over the 12 weeks of treatment.*

Figure 6 - tadalafil figure6

Figure 6 - tadalafil figure6

Figure 7 - tadalafil figure7

Figure 7 - tadalafil figure7

Figure 8 - tadalafil figure8

Figure 8 - tadalafil figure8

Chemical Structure - tadalafil structure

Chemical Structure - tadalafil structure

* The product label images have been analyzed using a combination of traditional computing and machine learning techniques. It should be noted that the descriptions provided may not be entirely accurate as they are experimental in nature. Use the information in this page at your own discretion and risk.