Carvedilol Tablet, Film Coated
Product Images NDC 68071-5275

6 FDA label images from Nucare Pharmaceuticals,inc. · Packaging, Regulatory Labels, and Product Appearance

Product Visual Gallery

This gallery contains 6 technical images submitted to the FDA as part of the official labeling for Carvedilol (NDC 68071-5275). Unlike standard consumer photos, these assets often include clinical data figures, molecular chemical structures, and official manufacturer packaging layouts.

As provided by Nucare Pharmaceuticals,inc., these visuals offer a comprehensive scientific overview of the product's physical and chemical identity, aiding pharmacists and researchers in product verification and study.

FDA Label Image

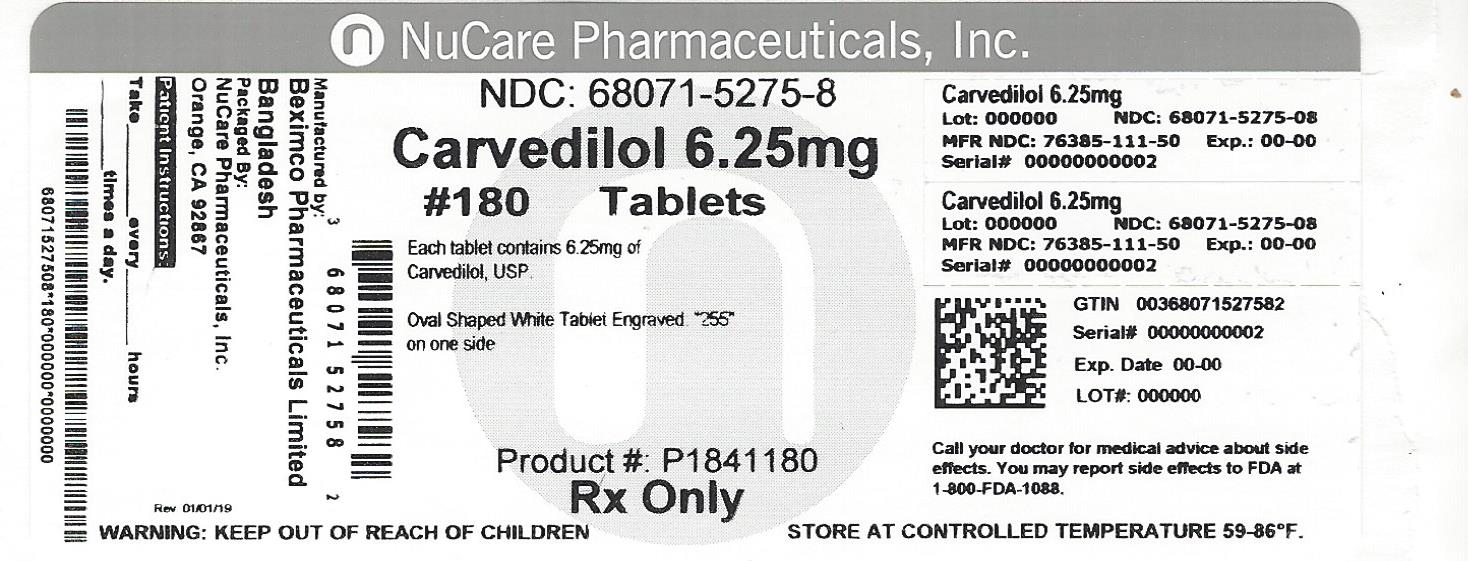
Pdp (68074 5275 8)

Pdp (68074 5275 8)
Carvedilol 6.25 mg film-coated tablets label from NuCare Pharmaceuticals, Inc. The label indicates 180 tablets per package, with each oval-shaped white tablet engraved with '255' on one side. Manufactured by Beximco Pharmaceuticals Limited, Bangladesh. Includes multiple barcodes, NDC 68071-5275-8, and storage instructions to keep at 59-86°F and out of reach of children.*
FDA Label Image

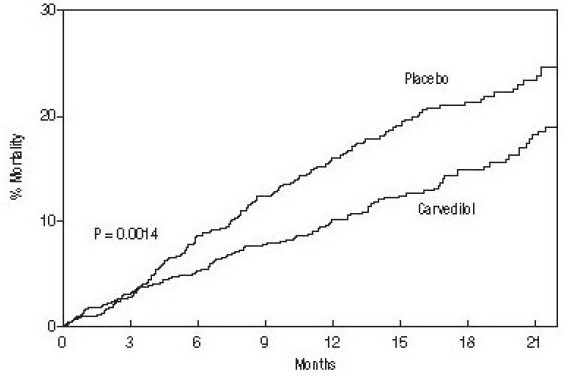
Figure 1 (Figure 1)

Figure 1 (Figure 1)
A line graph comparing percentage mortality over 21 months between placebo and Carvedilol treatment groups. The x-axis represents time in months, and the y-axis shows percentage mortality. The graph indicates lower mortality for Carvedilol compared to placebo, with a p-value of 0.0014 shown.*
FDA Label Image

Figure 2 (Figure 2)

Figure 2 (Figure 2)
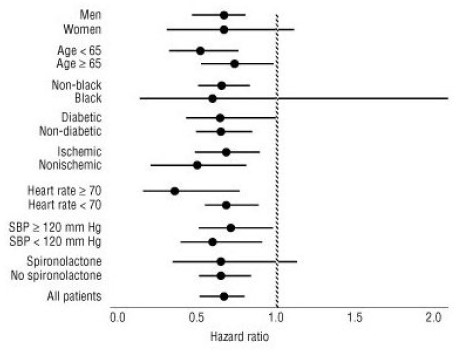
A forest plot displaying hazard ratios with 95% confidence intervals for different patient subgroups, including men, women, age groups, race, diabetic status, ischemic conditions, heart rate, systolic blood pressure, and spironolactone use. Each subgroup is represented by a point estimate and horizontal lines indicating variability, against a reference line at a hazard ratio of 1.0.*
FDA Label Image

Figure 3 (Figure 3)

Figure 3 (Figure 3)
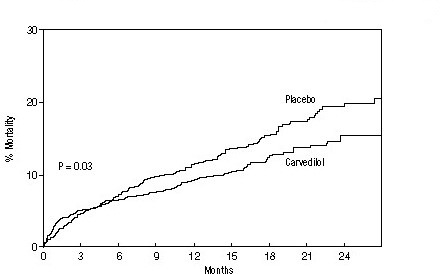
A line graph comparing percentage mortality over 24 months between two groups labeled Placebo and Carvedilol. The x-axis represents time in months, and the y-axis displays percentage mortality. A P-value of 0.03 is shown, indicating statistical comparison between the groups.*
FDA Label Image

Figure 4 (Figure 4)

Figure 4 (Figure 4)
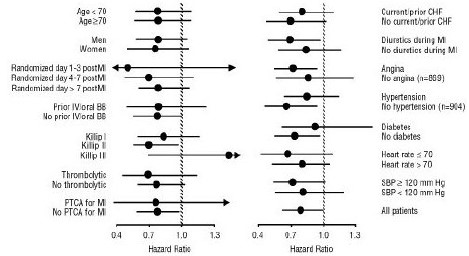
A forest plot chart displaying hazard ratios for various subgroups in a clinical analysis. Subgroups include age, gender, randomization timing post myocardial infarction, beta-blocker usage, Killip class, thrombolytic therapy, PTCA for MI, previous heart failure, diuretic use, angina, hypertension, diabetes, heart rate, and systolic blood pressure. The plot shows the confidence intervals for each hazard ratio around the vertical line at 1.0, comparing different patient characteristics and treatment variables.*
FDA Label Image

Structural Formula (Structure)

Structural Formula (Structure)
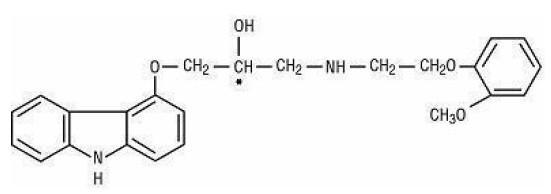
Chemical structure diagram of Carvedilol depicting its molecular framework with labeled atoms and bonds, including aromatic rings and hydroxyl groups.*

* About these descriptions: Image descriptions on this page are generated by automated AI analysis of the product label images from the manufacturer's FDA label submission (SPL). They are provided for reference only and may contain errors or omissions. Always rely on the printed label itself and the official FDA labeling, and consult a pharmacist or healthcare professional with any questions about this product.