Figure 1 (Kuvan 1)
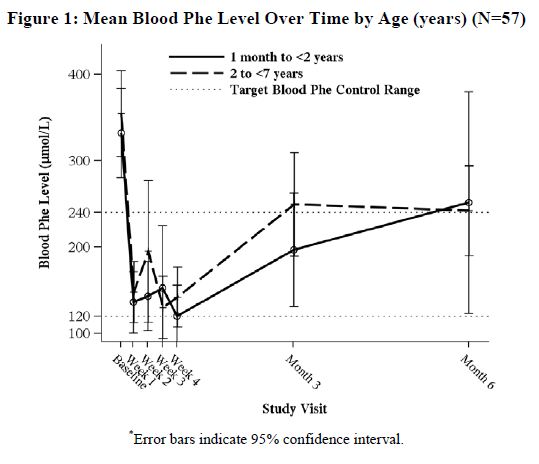
The text describes a figure labelled as "Figure 1" which shows the mean blood Phe level over time by age (in years) based on a study with 57 participants. The figure includes a target blood Phe control range which is less than 3. The text also mentions that the error bars in the figure represent a 95% confidence interval.*