Ticlopidine Hydrochloride
Product Images NDC 68151-0079

4 FDA label images from Carilion Materials Management · Packaging, Regulatory Labels, and Product Appearance

Product Visual Gallery

This gallery contains 4 technical images submitted to the FDA as part of the official labeling for Ticlopidine Hydrochloride (NDC 68151-0079). Unlike standard consumer photos, these assets often include clinical data figures, molecular chemical structures, and official manufacturer packaging layouts.

As provided by Carilion Materials Management, these visuals offer a comprehensive scientific overview of the product's physical and chemical identity, aiding pharmacists and researchers in product verification and study.

FDA Label Image

Label Image (68151 0079)
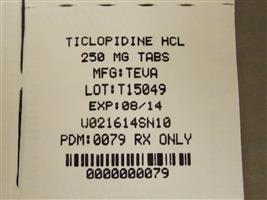
Label Image (68151 0079)
Label for Ticlopidine Hydrochloride 250 mg tablets. The label shows the manufacturer as Teva, lot number T15049, expiration date 08/14, and notes that the product is prescription only. It includes a barcode and the NDC code 0079.*
FDA Label Image

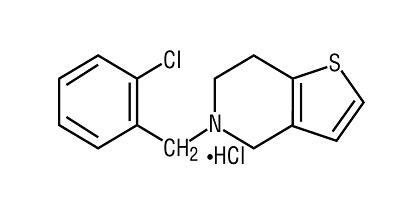
Structural Formula For Ticlopidine Hydrochloride (9eb85706 4a4a 441f 9fa7 B06ccd4c3c59 01)

Structural Formula For Ticlopidine Hydrochloride (9eb85706 4a4a 441f 9fa7 B06ccd4c3c59 01)
Chemical structure of Ticlopidine Hydrochloride, showing the molecular arrangement including a chlorobenzene ring, a piperidine ring, and a thiophene ring with hydrochloride indicated.*
FDA Label Image

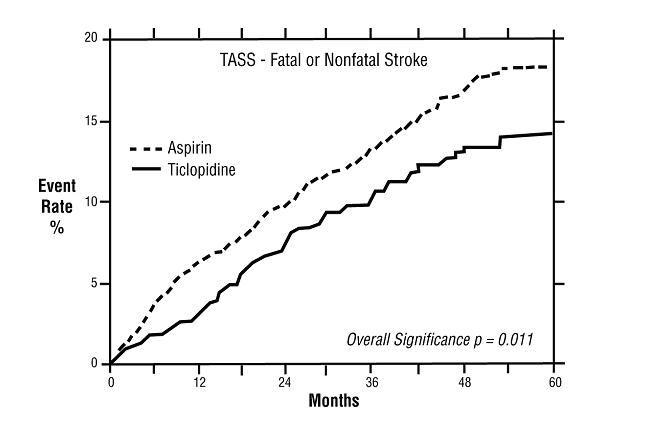
Study In Patients Experiencing Stroke Precursors (9eb85706 4a4a 441f 9fa7 B06ccd4c3c59 02)

Study In Patients Experiencing Stroke Precursors (9eb85706 4a4a 441f 9fa7 B06ccd4c3c59 02)
A line graph comparing event rates of fatal or nonfatal stroke over 60 months for Aspirin and Ticlopidine. The y-axis shows event rate percentages from 0 to 20%, and the x-axis shows time in months from 0 to 60. Ticlopidine shows a lower event rate curve compared to Aspirin. The graph includes a significance annotation with p = 0.011.*
FDA Label Image

Study In Patients Who Had A Completed Atherothrombotic Stroke (9eb85706 4a4a 441f 9fa7 B06ccd4c3c59 03)

Study In Patients Who Had A Completed Atherothrombotic Stroke (9eb85706 4a4a 441f 9fa7 B06ccd4c3c59 03)
A line graph comparing event rates (%) of fatal or nonfatal stroke over a 36-month period between placebo and Ticlopidine groups in the CATS study. The graph shows lower event rates for Ticlopidine compared to placebo, with overall significance p = 0.017.*

* About these descriptions: Image descriptions on this page are generated by automated AI analysis of the product label images from the manufacturer's FDA label submission (SPL). They are provided for reference only and may contain errors or omissions. Always rely on the printed label itself and the official FDA labeling, and consult a pharmacist or healthcare professional with any questions about this product.