Fluvastatin Sodium
Product Images NDC 68151-1326

View Photos of Packaging, Regulatory Labels, and Product Appearance

Product Visual Gallery

This gallery contains 6 technical images submitted to the FDA as part of the official labeling for Fluvastatin Sodium (NDC 68151-1326). Unlike standard consumer photos, these assets often include clinical data figures, molecular chemical structures, and official manufacturer packaging layouts.

As provided by Carilion Materials Management, these visuals offer a comprehensive scientific overview of the product's physical and chemical identity, aiding pharmacists and researchers in product verification and study.

FDA Label Image

Label Image (68151 1326)
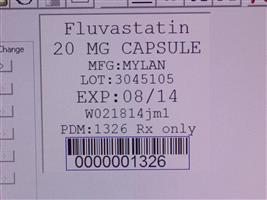
Label Image (68151 1326)
Label for Fluvastatin Sodium 20 mg capsules manufactured by Mylan. The label includes lot number 3045105, expiration date 08/14, an NDC barcode with the number 0000001326, and indicates prescription use only.*
FDA Label Image

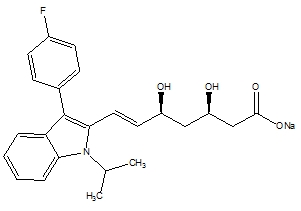
Fluvastatin Structural Formula (7f4945a8 B0a0 41ec 984c E2a34812bb8b 01)

Fluvastatin Structural Formula (7f4945a8 B0a0 41ec 984c E2a34812bb8b 01)
Chemical structure of Fluvastatin Sodium, showing its molecular components including fluorophenyl, indole, and hydroxy acid groups, with the sodium salt form indicated.*
FDA Label Image

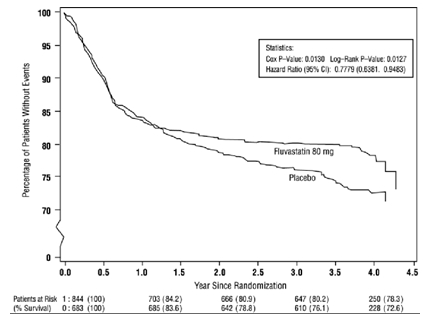
Figure 1: Primary Endpoint (Recurrent Cardiac Events (Cardiac Death, Nonfatal MI or Revascularization Procedure) (ITT Population))

Figure 1: Primary Endpoint (Recurrent Cardiac Events (Cardiac Death, Nonfatal MI or Revascularization Procedure) (ITT Population))
A Kaplan-Meier survival curve showing the percentage of patients without events over 4.5 years since randomization, comparing Fluvastatin 80 mg and placebo groups. The graph includes statistical values such as Cox P-Value, Log-Rank P-Value, and Hazard Ratio with confidence intervals, along with patient numbers at risk over time.*
FDA Label Image

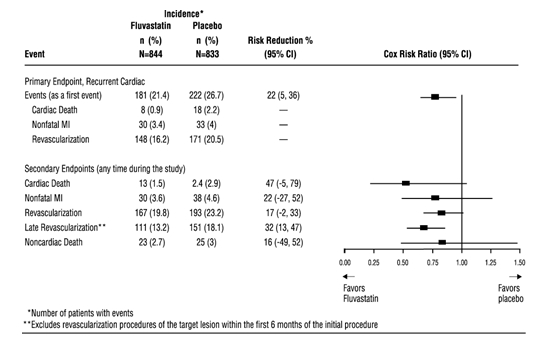
Figure 2: Fluvastatin Capsules Intervention Prevention Study (Primary and Secondary Endpoints)

Figure 2: Fluvastatin Capsules Intervention Prevention Study (Primary and Secondary Endpoints)
A forest plot chart depicting risk reduction and Cox risk ratios for various cardiac events comparing Fluvastatin and placebo groups. The chart lists event categories with corresponding incidence percentages and graphically shows confidence intervals for risk ratios, indicating effect directions favoring either fluvastatin or placebo.*
FDA Label Image

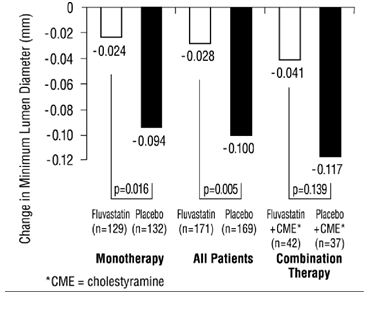
Figure 3: Change In Minimum Lumen Diameter (mm) (7f4945a8 B0a0 41ec 984c E2a34812bb8b 04)

Figure 3: Change In Minimum Lumen Diameter (mm) (7f4945a8 B0a0 41ec 984c E2a34812bb8b 04)
A bar chart showing changes in minimum lumen diameter (mm) for Fluvastatin Sodium versus placebo across three groups: Monotherapy, All Patients, and Combination Therapy with cholestyramine (CME). Bars represent mean changes with associated sample sizes and p-values for statistical significance.*
FDA Label Image

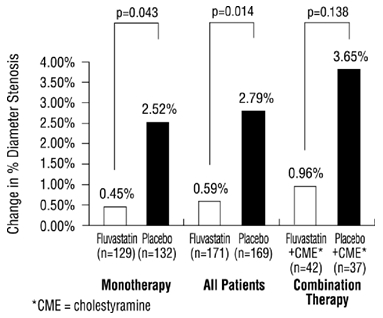
Figure 4: Change In % Diameter Stenosis (7f4945a8 B0a0 41ec 984c E2a34812bb8b 05)

Figure 4: Change In % Diameter Stenosis (7f4945a8 B0a0 41ec 984c E2a34812bb8b 05)
A bar chart comparing the change in percentage diameter stenosis among patients treated with Fluvastatin alone versus placebo. It shows results for monotherapy, all patients, and combination therapy with cholestyramine (CME). Each group includes patient counts, and p-values indicating statistical comparisons between treatments are displayed above the bars.*

* About these descriptions: Image descriptions on this page are generated by automated AI analysis of the product label images from the manufacturer's FDA label submission (SPL). They are provided for reference only and may contain errors or omissions. Always rely on the printed label itself and the official FDA labeling, and consult a pharmacist or healthcare professional with any questions about this product.