Str (94fb4253 7822 4043 8ef9 0f8d93642feb 01)

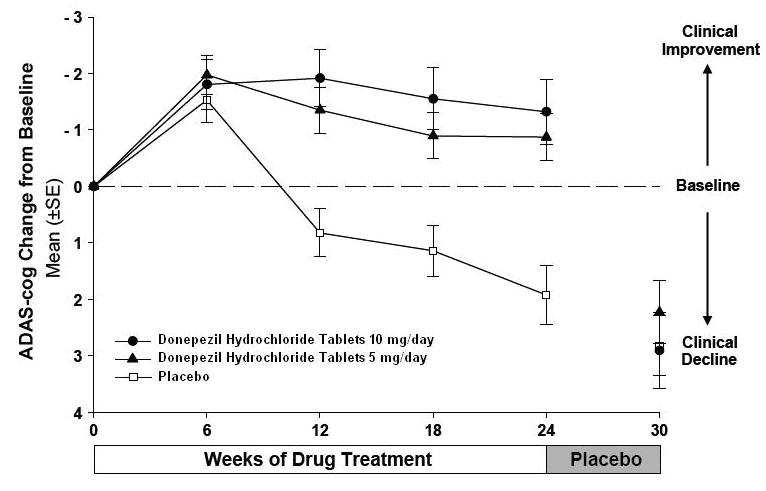
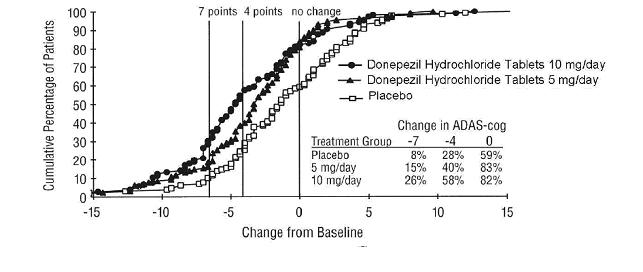
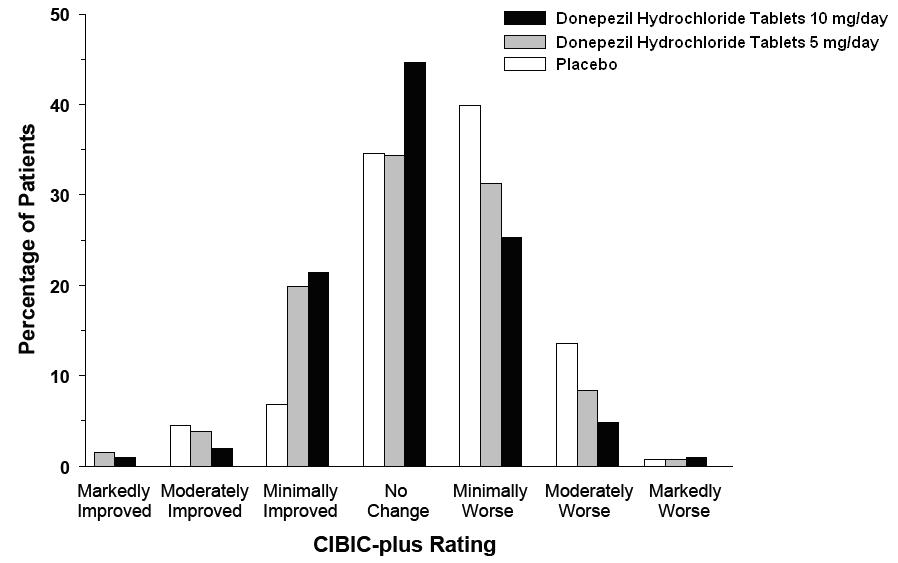
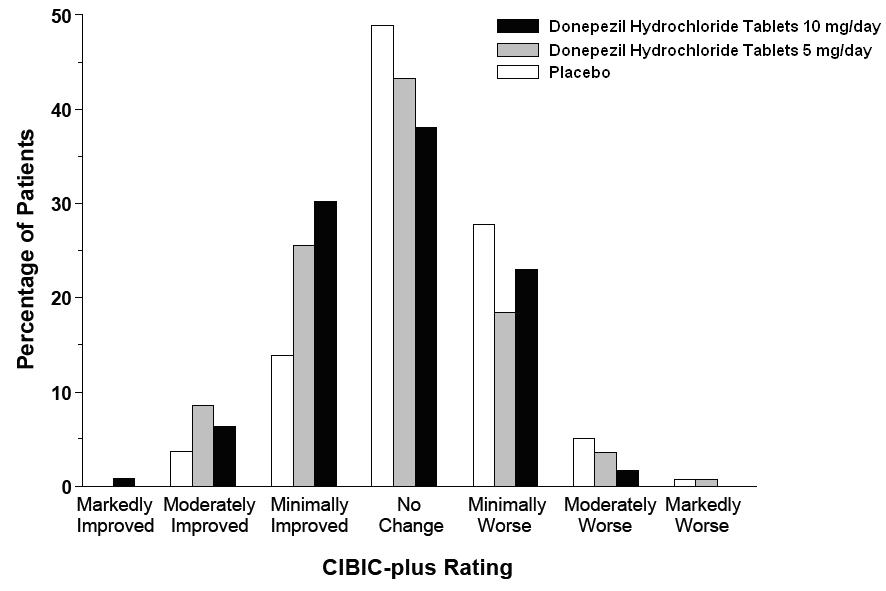
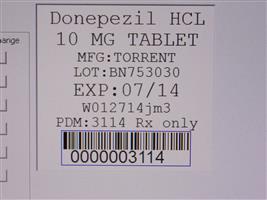
This gallery contains 14 technical images submitted to the FDA as part of the official labeling for Donepezil Hydrochloride (NDC 68151-3114). Unlike standard consumer photos, these assets often include clinical data figures, molecular chemical structures, and official manufacturer packaging layouts.
As provided by Carilion Materials Management, these visuals offer a comprehensive scientific overview of the product's physical and chemical identity, aiding pharmacists and researchers in product verification and study.


* These product label images have been analyzed using experimental machine learning. Please verify findings with the primary label text.