Figure 1: Change In Height (cm) From Randomization Visit By Scheduled Week (treatment Group Mean ± Standard Error Of The Mean) (Image 01)
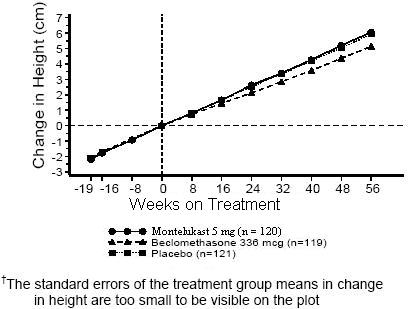
The text is describing a graph that shows the change in height (measured in cm) over a period of 56 weeks, with weeks on treatment shown on the x-axis and the treatment groups shown on the y-axis. The treatment groups are Montelukast, Beciomethasone, and a placebo (with 120, 119, and 2121 participants, respectively). The text notes that the standard errors for the treatment group means in change in height are too small to be visible in the graph.*


