Lescol
Product Images NDC 68151-4471

View Photos of Packaging, Regulatory Labels, and Product Appearance

Product Visual Gallery

This gallery contains 7 technical images submitted to the FDA as part of the official labeling for Lescol (NDC 68151-4471). Unlike standard consumer photos, these assets often include clinical data figures, molecular chemical structures, and official manufacturer packaging layouts.

As provided by Carilion Materials Management, these visuals offer a comprehensive scientific overview of the product's physical and chemical identity, aiding pharmacists and researchers in product verification and study.

FDA Label Image

Label Image (68151 4471)
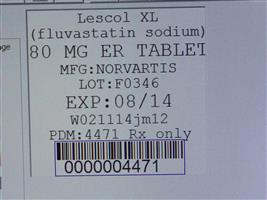
Label Image (68151 4471)
Label for Lescol XL (fluvastatin sodium) 80 mg extended-release tablet. The label includes manufacturing information, expiration date (08/14), batch/lot number, and a barcode. Manufactured by Norvartis and distributed by Carilion Materials Management.*
FDA Label Image

Sandoz Logo (Lescol 01)

FDA Label Image

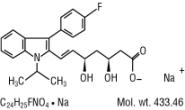
Fluvastatin Sodium Structural Formula (Lescol 02)

Fluvastatin Sodium Structural Formula (Lescol 02)
Chemical structure of Lescol XL showing the molecular formula C24H25FNO4 with sodium and a molecular weight of 433.46.*
FDA Label Image

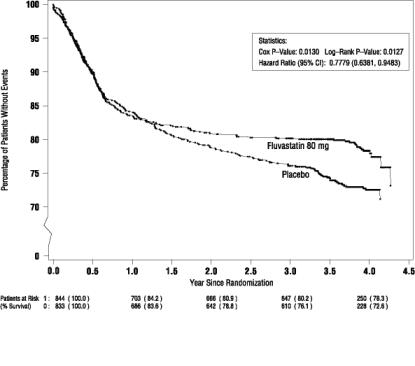
Figure 1. Primary Endpoint – Recurrent Cardiac Events (cardiac Death, Nonfatal Mi Or Revascularization Procedure) (itt Population) (Lescol 03)

Figure 1.	Primary Endpoint – Recurrent Cardiac Events (cardiac Death, Nonfatal Mi Or Revascularization Procedure) (itt Population) (Lescol 03)
A Kaplan-Meier survival curve graph comparing patients without events over time between Fluvastatin 80 mg and placebo groups. The x-axis shows years since randomization up to 4.5 years, and the y-axis shows the percentage of patients without events from 70% to 100%. Statistical results including Cox P-Value, Log-Rank P-Value, and Hazard Ratio with confidence intervals are shown in a box within the chart.*
FDA Label Image

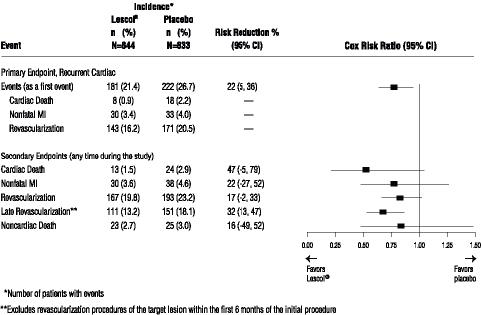
Figure 2. Lescol® Intervention Prevention Study (Primary and Secondary Endpoints)

Figure 2.	Lescol® Intervention Prevention Study (Primary and Secondary Endpoints)
A Kaplan-Meier style forest plot comparing incidence of clinical events (primary and secondary endpoints) between Lescol XL and placebo groups. The chart shows the percentage of patients with cardiac death, nonfatal myocardial infarction, and revascularization events, alongside risk reduction percentages and Cox risk ratios with 95% confidence intervals indicating relative benefit between Lescol XL and placebo over the study period.*
FDA Label Image

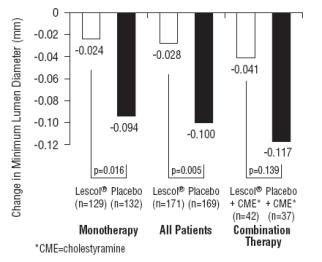
Figure 3 Change In Minimum Lumen Diameter (mm) (Lescol 05)

Figure 3 Change In Minimum Lumen Diameter (mm) (Lescol 05)
A bar graph comparing the change in minimum lumen diameter (mm) between Lescol XL and placebo across three groups: Monotherapy, All Patients, and Combination Therapy with CME (cholestyramine). The graph shows more negative changes for placebo groups in each category, with sample sizes noted for each group.*
FDA Label Image

Figure 4 Change In % Diameter Stenosis (Lescol 06)

Figure 4 Change In % Diameter Stenosis (Lescol 06)
A bar chart comparing the percentage change in diameter stenosis among different patient groups treated with Lescol XL versus placebo. The groups shown are Monotherapy, All Patients, and Combination Therapy, with respective sample sizes and p-values indicated. The chart highlights higher percentage changes in diameter stenosis for placebo groups compared to Lescol XL in Monotherapy and All Patients categories.*

* About these descriptions: Image descriptions on this page are generated by automated AI analysis of the product label images from the manufacturer's FDA label submission (SPL). They are provided for reference only and may contain errors or omissions. Always rely on the printed label itself and the official FDA labeling, and consult a pharmacist or healthcare professional with any questions about this product.