Chantix
Product Images NDC 68151-4952

6 FDA label images from Carilion Materials Management · Packaging, Regulatory Labels, and Product Appearance

Product Visual Gallery

This gallery contains 6 technical images submitted to the FDA as part of the official labeling for Chantix (NDC 68151-4952). Unlike standard consumer photos, these assets often include clinical data figures, molecular chemical structures, and official manufacturer packaging layouts.

As provided by Carilion Materials Management, these visuals offer a comprehensive scientific overview of the product's physical and chemical identity, aiding pharmacists and researchers in product verification and study.

FDA Label Image

Label Image (68151 4952)

Label Image (68151 4952)
Label for CHANTIX 1 mg tablets containing varenicline, manufactured by Pfizer. The label includes a lot number, expiration date of 10/14, and a barcode with the number 0000004952. It is marked RX only with product NDC 68151-4952.*
FDA Label Image

Chemical Structure (Chantix 01)

Chemical Structure (Chantix 01)
Chemical structure diagram showing two molecular structures side by side. The left structure includes a chiral carbon with hydroxyl and carboxyl groups, while the right structure depicts a bicyclic nitrogen-containing heterocycle. This image represents the chemical structure related to the active ingredient of CHANTIX, a Carilion Materials Management product.*
FDA Label Image

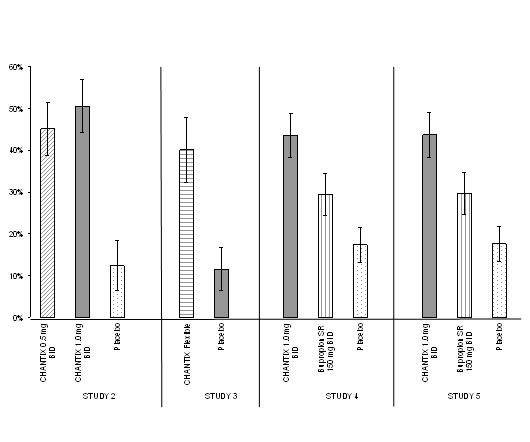
Figure 1 (Chantix 02)

Figure 1 (Chantix 02)
A bar graph comparing study results across five studies labeled Study 2 to Study 5. Each study shows bars for CHANTIX at different dosages or forms, bupropion SR, and placebo with corresponding error bars indicating variability. The y-axis represents percentages from 0% to 60%.*
FDA Label Image

Figure 2 (Chantix 03)

Figure 2 (Chantix 03)
A bar chart comparing efficacy or response percentages across multiple studies (Study 2 to Study 5) for CHANTIX 0.5 mg, CHANTIX 1.0 mg, various placebo groups, and Chantix flexible dosing. The y-axis shows percentage from 0% to 35%, with error bars on each bar.*
FDA Label Image

Figure 3 (Chantix 04)

Figure 3 (Chantix 04)
A line graph depicting continuous abstinent percentages over non-treatment follow-up weeks for CHANTIX 1.0 mg BID versus placebo. The x-axis shows duration in weeks, and the y-axis shows percent continuous abstinent. Two lines represent CHANTIX and placebo trends, indicating abstinence rates decreasing over time.*
FDA Label Image

Company Logo (Chantix 05)

* About these descriptions: Image descriptions on this page are generated by automated AI analysis of the product label images from the manufacturer's FDA label submission (SPL). They are provided for reference only and may contain errors or omissions. Always rely on the printed label itself and the official FDA labeling, and consult a pharmacist or healthcare professional with any questions about this product.