Coreg
Product Images NDC 68151-5050

View Photos of Packaging, Regulatory Labels, and Product Appearance

Product Visual Gallery

This gallery contains 7 technical images submitted to the FDA as part of the official labeling for Coreg (NDC 68151-5050). Unlike standard consumer photos, these assets often include clinical data figures, molecular chemical structures, and official manufacturer packaging layouts.

As provided by Carilion Materials Management, these visuals offer a comprehensive scientific overview of the product's physical and chemical identity, aiding pharmacists and researchers in product verification and study.

FDA Label Image

Carvedilol Phosphate Chemical Structure (Coreg Cr Spl Graphic 01)

Carvedilol Phosphate Chemical Structure (Coreg Cr Spl Graphic 01)
Chemical structure diagram depicting the active ingredient of COREG CR, including the molecular components and associated phosphate and water molecules.*
FDA Label Image

Figure 1. Survival Analysis For Copernicus (intent-to-treat) (Coreg Cr Spl Graphic 02)

Figure 1. Survival Analysis For Copernicus (intent-to-treat) (Coreg Cr Spl Graphic 02)
A line graph showing percent mortality over 21 months comparing two groups labeled as Placebo and Carvedilol. The x-axis represents time in months, and the y-axis shows percent mortality from 0 to 30%. The graph indicates lower mortality for the Carvedilol group compared to Placebo, with a p-value of 0.0014 noted.*
FDA Label Image

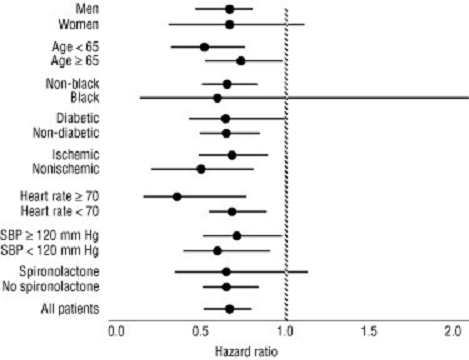
Figure 2. Effects On Mortality For Subgroups In Copernicus (Coreg Cr Spl Graphic 03)

Figure 2. Effects On Mortality For Subgroups In Copernicus (Coreg Cr Spl Graphic 03)
A horizontal forest plot illustrating hazard ratios for various patient subgroups related to a medical study. Subgroups include gender, age, race, diabetes status, ischemic condition, heart rate, systolic blood pressure categories, and spironolactone use. The x-axis represents hazard ratio values from 0.0 to 2.0, with a vertical reference line at 1.0 indicating no effect. Each subgroup is marked with a point estimate and confidence intervals depicted as horizontal lines.*
FDA Label Image

Figure 3. Survival Analysis For Capricorn (intent-to-treat) (Coreg Cr Spl Graphic 04)

Figure 3. Survival Analysis For Capricorn (intent-to-treat) (Coreg Cr Spl Graphic 04)
A line graph comparing percent mortality over 24 months between two groups labeled Placebo and Carvedilol. The x-axis represents time in months, and the y-axis shows percent mortality. The Carvedilol group shows a lower mortality rate than the Placebo group, with a p-value of 0.03 indicated on the graph.*
FDA Label Image

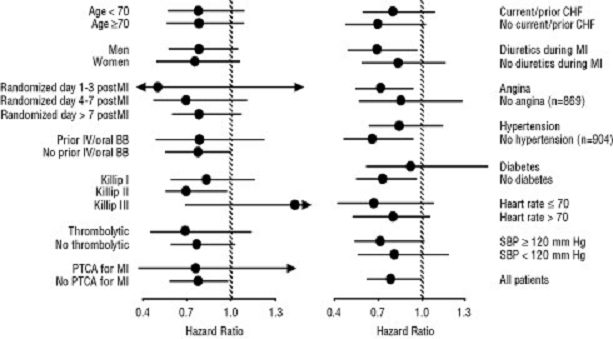
Figure 4. Effects On Mortality For Subgroups In Capricorn (Coreg Cr Spl Graphic 05)

Figure 4. Effects On Mortality For Subgroups In Capricorn (Coreg Cr Spl Graphic 05)
A forest plot showing hazard ratios with 95% confidence intervals for various patient subgroups, including age, sex, timing of randomization post-myocardial infarction, prior use of IV/oral beta blockers, Killip classification, thrombolytic therapy, percutaneous transluminal coronary angioplasty status, presence of congestive heart failure, diuretic use during myocardial infarction, angina, hypertension, diabetes, heart rate, and systolic blood pressure. Each subgroup's hazard ratio is plotted along a horizontal axis ranging approximately from 0.4 to 1.3.*
FDA Label Image

Figure 5. Changes From Baseline In Systolic Blood Pressure And Diastolic Blood Pressure Measured By 24-hour Abpm (Coreg Cr Spl Graphic 06)

Figure 5. Changes From Baseline In Systolic Blood Pressure And Diastolic Blood Pressure Measured By 24-hour Abpm (Coreg Cr Spl Graphic 06)
Two line graphs showing the change in blood pressure over 24 hours after the morning dose of COREG CR in 20 mg, 40 mg, and 80 mg strengths. The top graph depicts systolic blood pressure changes, and the bottom shows diastolic blood pressure changes, with time in hours on the x-axis.*
FDA Label Image

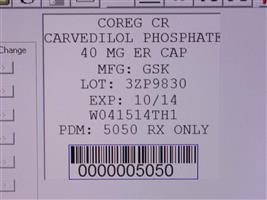
Label Image (Lbl681515050)

Label Image (Lbl681515050)
Label of COREG CR (Carvedilol Phosphate) 40 mg extended-release capsule. Manufacturer is GSK. The label includes lot number, expiration date of 10/14, and a barcode with the number 0000005050. Designated for prescription use only.*

* About these descriptions: Image descriptions on this page are generated by automated AI analysis of the product label images from the manufacturer's FDA label submission (SPL). They are provided for reference only and may contain errors or omissions. Always rely on the printed label itself and the official FDA labeling, and consult a pharmacist or healthcare professional with any questions about this product.