Label Image (Lbl681515113)

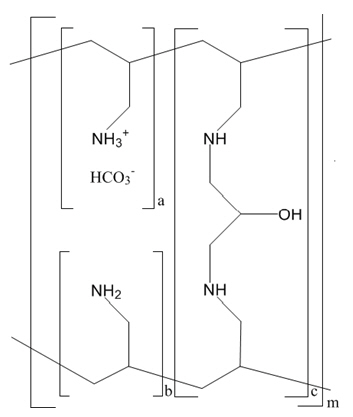
Renvela is a medication containing sevelamer carbonate manufactured by Genzyme. This medication comes in the form of an 800 mg tablet and is associated with the lot number B3548B01 and the expiration date of 09/14. The remaining text is not readable due to errors.*