Namenda
Product Images NDC 68151-5755

7 FDA label images from Carilion Materials Management · Packaging, Regulatory Labels, and Product Appearance

Product Visual Gallery

This gallery contains 7 technical images submitted to the FDA as part of the official labeling for Namenda (NDC 68151-5755). Unlike standard consumer photos, these assets often include clinical data figures, molecular chemical structures, and official manufacturer packaging layouts.

As provided by Carilion Materials Management, these visuals offer a comprehensive scientific overview of the product's physical and chemical identity, aiding pharmacists and researchers in product verification and study.

FDA Label Image

Label Image (Lbl681515755)
Label Image (Lbl681515755)
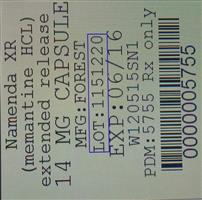
Namenda XR extended-release capsules label, 14 mg strength, showing drug name, capsule form, lot number, expiration date, and labeler Carilion Materials Management. The label includes dosage form details and barcode for product identification.*
FDA Label Image

Label Image (Lbl681515829)

Label Image (Lbl681515829)
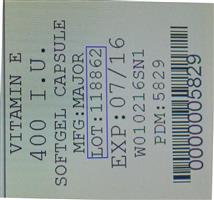
Label for Vitamin E 400 IU Softgel Capsule from Carilion Materials Management. The label includes the lot number 1708862, expiration date 01/2016, and a barcode. It also contains manufacturing and packaging codes W0102165N1 and PDM 5829.*
FDA Label Image

Structural Formula (Nam09 0000 01)

Structural Formula (Nam09 0000 01)
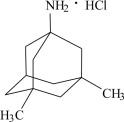
Chemical structure diagram showing the molecular structure of the active ingredient in Namenda XR. The structure includes labeled functional groups NH2, HCl, and CH3, illustrating the compound's chemical composition.*
FDA Label Image

Figure (Nam09 0000 02)

Figure (Nam09 0000 02)
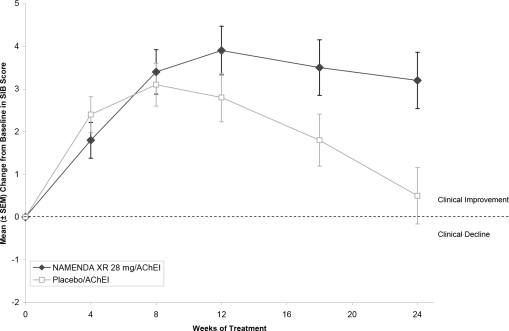
A line graph comparing the mean (± SEM) change from baseline in SIB Score over 24 weeks of treatment between NAMENDA XR 28 mg/AChEI and placebo/AChEI. The x-axis represents weeks of treatment (0 to 24), and the y-axis shows the change in SIB Score ranging from -2 to 5. The graph includes error bars and distinguishes clinical improvement and clinical decline thresholds.*
FDA Label Image

Figure (Nam09 0000 03)

Figure (Nam09 0000 03)
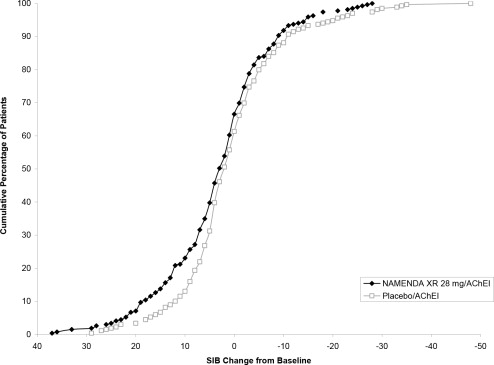
A cumulative percentage graph showing the change in SIB (Severe Impairment Battery) scores from baseline in patients. The graph compares two treatment groups: Namenda XR 28 mg/AChEI and Placebo/AChEI, with data points plotted for each group along the SIB change axis.*
FDA Label Image

Figure (Nam09 0000 04)

Figure (Nam09 0000 04)
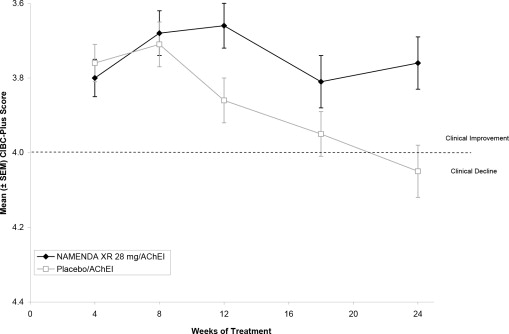
A line graph showing the mean change in CIBIC-Plus scores over 24 weeks of treatment comparing Namenda XR 28 mg/AChEI and placebo/AChEI groups. The vertical axis measures the CIBIC-Plus score with indications for clinical improvement and decline. Data points include error bars representing SEM.*
FDA Label Image

Figure (Nam09 0000 05)

Figure (Nam09 0000 05)
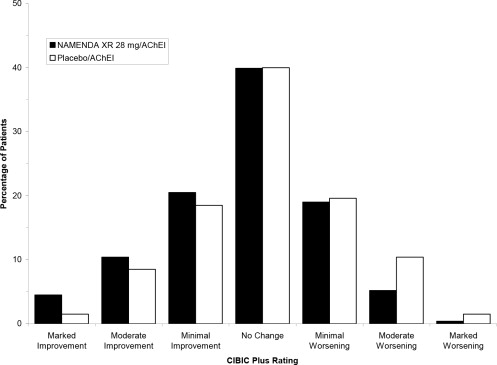
A bar chart comparing the percentage of patients rated on the CIBIC Plus scale for Namenda XR 28 mg/AChEI versus Placebo/AChEI. Categories include marked improvement, moderate improvement, minimal improvement, no change, minimal worsening, moderate worsening, and marked worsening, with most patients showing no change.*

* About these descriptions: Image descriptions on this page are generated by automated AI analysis of the product label images from the manufacturer's FDA label submission (SPL). They are provided for reference only and may contain errors or omissions. Always rely on the printed label itself and the official FDA labeling, and consult a pharmacist or healthcare professional with any questions about this product.