Silodosin Capsule
Product Images NDC 68180-741

8 FDA label images from Lupin Pharmaceuticals, Inc. · Packaging, Regulatory Labels, and Product Appearance

Product Visual Gallery

This gallery contains 8 technical images submitted to the FDA as part of the official labeling for Silodosin (NDC 68180-741). Unlike standard consumer photos, these assets often include clinical data figures, molecular chemical structures, and official manufacturer packaging layouts.

As provided by Lupin Pharmaceuticals, Inc., these visuals offer a comprehensive scientific overview of the product's physical and chemical identity, aiding pharmacists and researchers in product verification and study.

FDA Label Image

Silodosin (Ea8a1404 8562 4af9 Acce 0faf2be3dc7e 01)
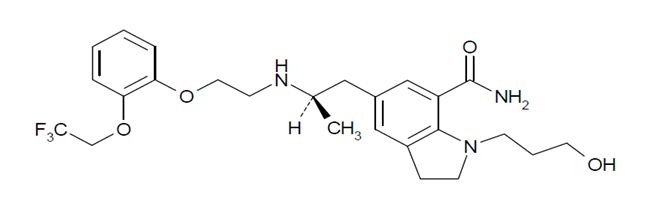
Silodosin (Ea8a1404 8562 4af9 Acce 0faf2be3dc7e 01)
Chemical structure of silodosin, shown as a 2D molecular diagram displaying its arrangement of atoms and bonds, including aromatic rings, functional groups, and stereochemistry.*
FDA Label Image

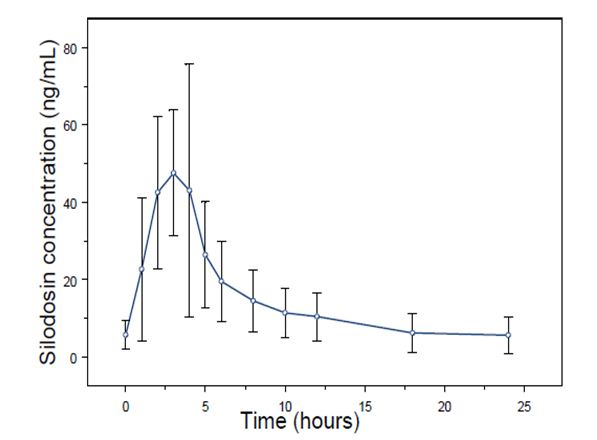
Figure 1 (Ea8a1404 8562 4af9 Acce 0faf2be3dc7e 02)

Figure 1 (Ea8a1404 8562 4af9 Acce 0faf2be3dc7e 02)
A line graph showing silodosin concentration (ng/mL) over 24 hours post-dose. The x-axis represents time in hours, while the y-axis shows silodosin concentration. The graph includes error bars at each time point, indicating variability in concentration measurements.*
FDA Label Image

Figure 2 (Ea8a1404 8562 4af9 Acce 0faf2be3dc7e 03)

Figure 2 (Ea8a1404 8562 4af9 Acce 0faf2be3dc7e 03)
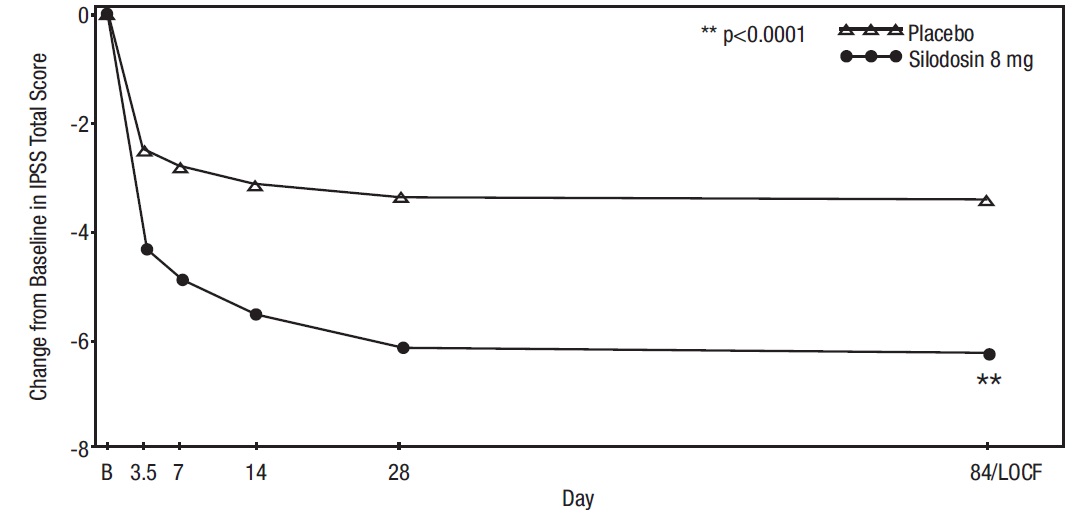
Line graph depicting change from baseline in IPSS total score over time for Silodosin 8 mg compared to placebo. The x-axis represents days (baseline, 3.5, 7, 14, 28, 84/LOCF), and the y-axis shows the change in score. Silodosin 8 mg shows a greater decrease in IPSS score versus placebo, with statistical significance indicated.*
FDA Label Image

Figure 3 (Ea8a1404 8562 4af9 Acce 0faf2be3dc7e 04)

Figure 3 (Ea8a1404 8562 4af9 Acce 0faf2be3dc7e 04)
A line graph comparing the change from baseline in IPSS total score over days for Silodosin 8 mg capsules versus placebo. The x-axis represents days (B, 3.5, 7, 14, 28, and 84/LOCF), and the y-axis shows the change score ranging from 0 to -8. Silodosin shows a greater reduction in IPSS total score compared to placebo, with statistical significance indicated at p<0.0001.*
FDA Label Image

Figure 4 (Ea8a1404 8562 4af9 Acce 0faf2be3dc7e 05)

Figure 4 (Ea8a1404 8562 4af9 Acce 0faf2be3dc7e 05)
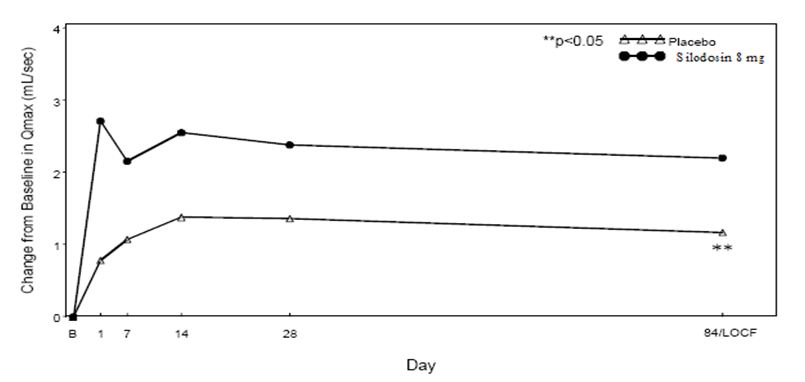
A line graph comparing the change from baseline in Qmax (mL/sec) over time (days) between Silodosin 8 mg and placebo groups. The X-axis shows days including baseline, 1, 7, 14, 28, and 84/LOCF, while the Y-axis indicates change in Qmax from 0 to 4 mL/sec. Silodosin shows a higher increase in Qmax compared to placebo throughout the study period, with statistically significant differences (p < 0.05) noted.*
FDA Label Image

Figure 5 (Ea8a1404 8562 4af9 Acce 0faf2be3dc7e 06)

Figure 5 (Ea8a1404 8562 4af9 Acce 0faf2be3dc7e 06)
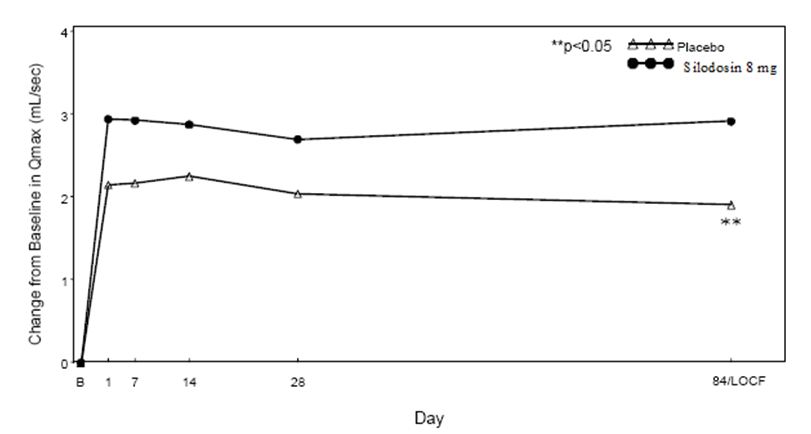
Line graph depicting change from baseline in Qmax (mL/sec) over time (days) for Silodosin 8 mg compared to placebo. The x-axis shows days ranging from baseline (B) to 84/LOCF, and the y-axis shows the change from baseline in Qmax. Silodosin 8 mg shows a higher increase in Qmax than placebo, with statistical significance indicated at p<0.05.*
FDA Label Image

Image 2 (Ea8a1404 8562 4af9 Acce 0faf2be3dc7e 07)

Image 2 (Ea8a1404 8562 4af9 Acce 0faf2be3dc7e 07)
Label for Silodosin Capsules 4 mg by Lupin Pharmaceuticals, Inc. The package contains 30 oral capsules. The label includes dosage instructions, storage conditions, and manufacturing information, with a barcode on the right side.*
FDA Label Image

Image 3 (Ea8a1404 8562 4af9 Acce 0faf2be3dc7e 08)

Image 3 (Ea8a1404 8562 4af9 Acce 0faf2be3dc7e 08)
Silodosin Capsules 8 mg oral capsules packaging label showing 30 capsules per container. The label identifies Lupin Pharmaceuticals, Inc. as the manufacturer in the United States and Lupin Limited in India. It includes storage instructions and usage warnings.*

* About these descriptions: Image descriptions on this page are generated by automated AI analysis of the product label images from the manufacturer's FDA label submission (SPL). They are provided for reference only and may contain errors or omissions. Always rely on the printed label itself and the official FDA labeling, and consult a pharmacist or healthcare professional with any questions about this product.