Tydemy Kit
Product Images NDC 68180-904

16 FDA label images from Lupin Pharmaceuticals, Inc. · Packaging, Regulatory Labels, and Product Appearance

Product Visual Gallery

This gallery contains 16 technical images submitted to the FDA as part of the official labeling for Tydemy (NDC 68180-904). Unlike standard consumer photos, these assets often include clinical data figures, molecular chemical structures, and official manufacturer packaging layouts.

As provided by Lupin Pharmaceuticals, Inc., these visuals offer a comprehensive scientific overview of the product's physical and chemical identity, aiding pharmacists and researchers in product verification and study.

FDA Label Image

Image (9229c82f E84e 4805 90d2 A77e0fad63b5 01)
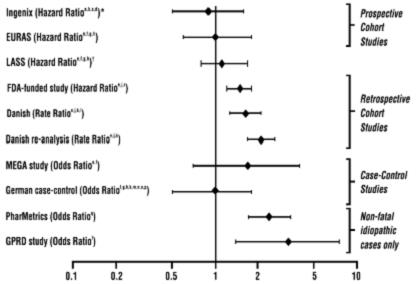
Image (9229c82f E84e 4805 90d2 A77e0fad63b5 01)
A forest plot chart depicting hazard and odds ratios from multiple studies, including Ingenix, EURAS, LASS, FDA-funded, Danish, MEGA, German case-control, PharMetrics, and GPRD. The chart groups studies into prospective cohort, retrospective cohort, case-control, and non-fatal idiopathic cases categories, showing relative risk estimates with confidence intervals plotted on a logarithmic scale.*
FDA Label Image

Image (9229c82f E84e 4805 90d2 A77e0fad63b5 02)

Image (9229c82f E84e 4805 90d2 A77e0fad63b5 02)
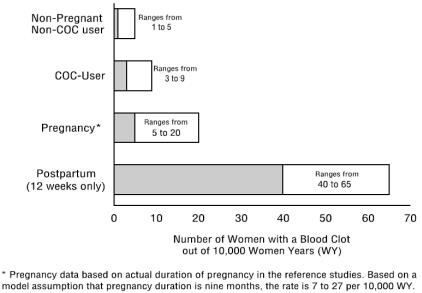
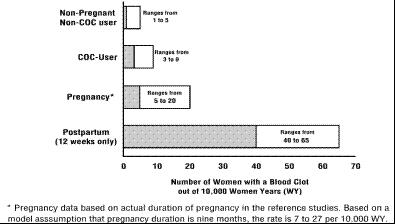
A horizontal bar chart comparing the range of values across different groups: Non-Pregnant Non-COC user, COC-User, Pregnancy, and Postpartum (12 weeks only). The chart quantifies a variable ranging from 1 to 65+ units, with the highest value seen in the Postpartum group. Notes below indicate pregnancy data is based on actual pregnancy duration and rate per 10,000 women years.*
FDA Label Image

Image (9229c82f E84e 4805 90d2 A77e0fad63b5 03)

Image (9229c82f E84e 4805 90d2 A77e0fad63b5 03)
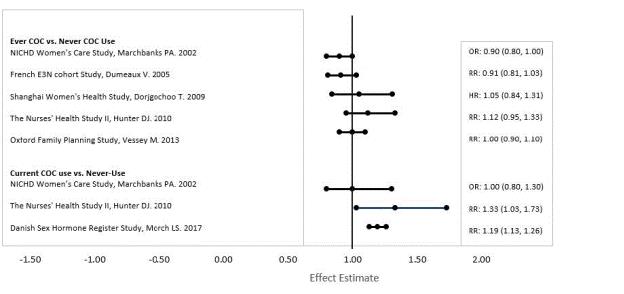
A forest plot comparing the effects of current combined oral contraceptive (COC) use versus never use. It displays multiple studies with their effect estimates, confidence intervals, odds ratios (OR), relative risks (RR), and hazard ratios (HR). The x-axis is labeled 'Effect Estimate,' ranging from -1.50 to 2.00, showing the comparisons visually across various studies from 2002 to 2017.*
FDA Label Image

Image (9229c82f E84e 4805 90d2 A77e0fad63b5 04)

Image (9229c82f E84e 4805 90d2 A77e0fad63b5 04)
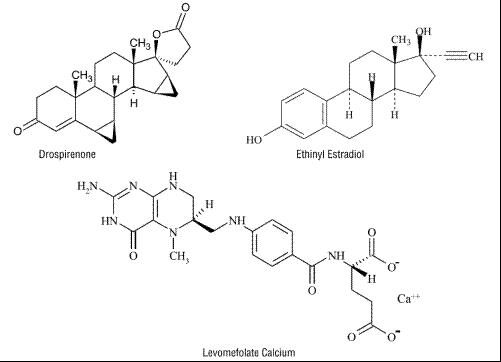
Chemical structure depiction showing the molecular formulas of Drospirenone, Ethinyl Estradiol, and Levomefolate Calcium. These structures illustrate the chemical composition of each active ingredient present in the product Tydemy by Lupin Pharmaceuticals, Inc.*
FDA Label Image

Image (9229c82f E84e 4805 90d2 A77e0fad63b5 05)

Image (9229c82f E84e 4805 90d2 A77e0fad63b5 05)
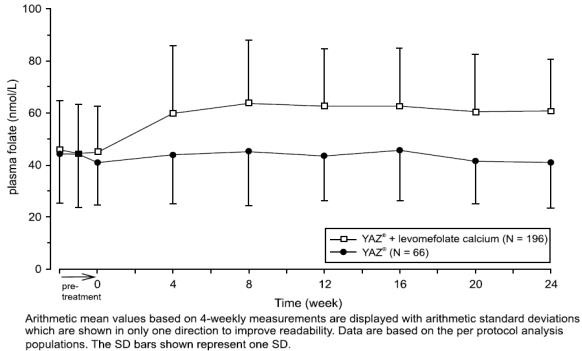
A line graph comparing plasma folate levels over 24 weeks for two groups taking YAZ® with and without levomefolate calcium. The x-axis represents time in weeks, and the y-axis shows plasma folate concentration in nmol/L. The graph includes error bars indicating standard deviations for each data point.*
FDA Label Image

Image (9229c82f E84e 4805 90d2 A77e0fad63b5 06)

Image (9229c82f E84e 4805 90d2 A77e0fad63b5 06)
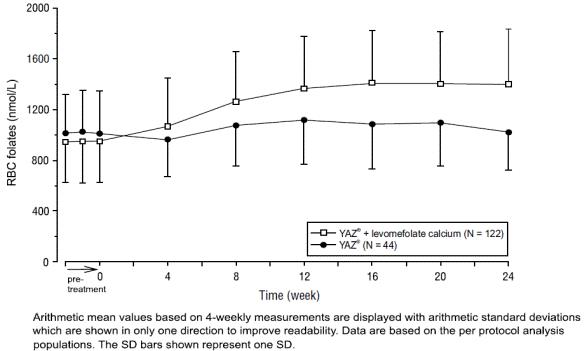
A line graph comparing red blood cell (RBC) folate levels (nmol/L) over 24 weeks between two groups: YAZ plus levomefolate calcium (N=122) and YAZ alone (N=44). The x-axis shows time in weeks from pre-treatment to 24 weeks, and the y-axis shows RBC folates levels. The chart includes arithmetic mean values with standard deviation error bars, illustrating higher RBC folate levels in the YAZ plus levomefolate group over time.*
FDA Label Image

Image (9229c82f E84e 4805 90d2 A77e0fad63b5 07)

Image (9229c82f E84e 4805 90d2 A77e0fad63b5 07)
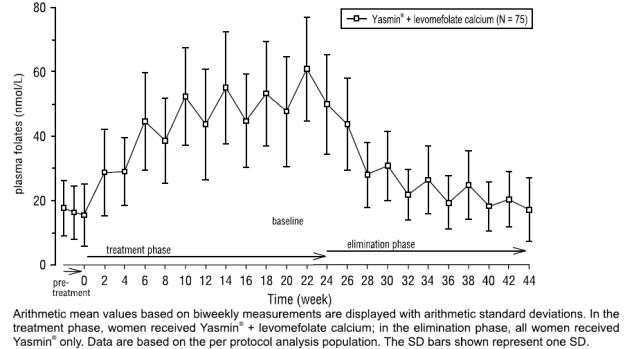
A line graph depicting plasma folate levels (nmol/L) over time (weeks) with error bars for standard deviations. The chart compares mean folate values during pre-treatment, treatment, baseline, and elimination phases for women receiving Yasmin plus levomefolate calcium. Data points show variability across 44 weeks.*
FDA Label Image

Image (9229c82f E84e 4805 90d2 A77e0fad63b5 08)

Image (9229c82f E84e 4805 90d2 A77e0fad63b5 08)
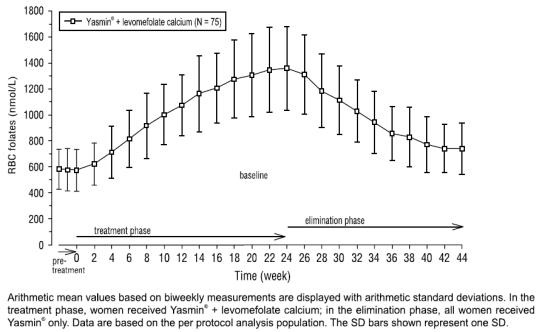
A line graph depicting RBC folate levels (nmol/L) over time (weeks) in patients treated with Yasmin plus levomefolate calcium. The x-axis represents time from pre-treatment to week 44, covering treatment and elimination phases. The y-axis shows RBC folate concentrations with standard deviation bars around arithmetic mean values based on biweekly measurements in 75 subjects.*
FDA Label Image

Image (9229c82f E84e 4805 90d2 A77e0fad63b5 09)

FDA Label Image

Image (9229c82f E84e 4805 90d2 A77e0fad63b5 10)

Image (9229c82f E84e 4805 90d2 A77e0fad63b5 10)
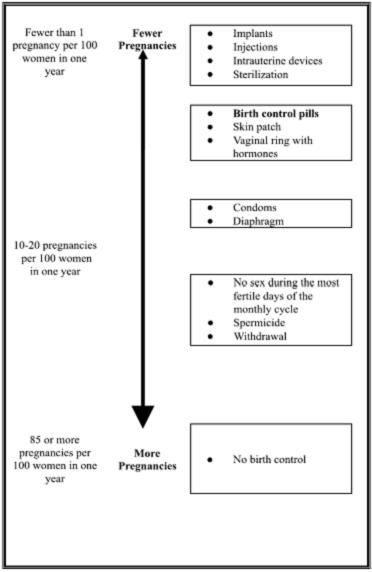
An instructional diagram illustrating pregnancy rates per 100 women per year in relation to different birth control methods. It shows a vertical arrow with 'Fewer Pregnancies' at the top and 'More Pregnancies' at the bottom, categorizing methods such as implants, injections, intrauterine devices, sterilization, birth control pills, skin patch, vaginal ring with hormones, condoms, diaphragm, fertility awareness methods, spermicide, withdrawal, and no birth control.*
FDA Label Image

Image (9229c82f E84e 4805 90d2 A77e0fad63b5 11)

Image (9229c82f E84e 4805 90d2 A77e0fad63b5 11)
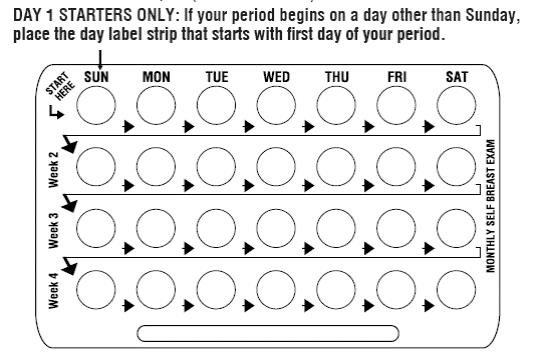
An instructional diagram showing a four-week pill organizer layout for Tydemy. It features rows labeled Week 2, Week 3, and Week 4, with columns for each day of the week (Sunday to Saturday). Instructions direct Day 1 starters to align the day label strip with the first day of their period. A note indicates monthly self breast exams.*
FDA Label Image

Image (9229c82f E84e 4805 90d2 A77e0fad63b5 12)

Image (9229c82f E84e 4805 90d2 A77e0fad63b5 12)
A horizontal bar chart showing the number of women with a blood clot per 10,000 women years among different groups: Non-Pregnant Non-COC users (range 1 to 5), COC-Users (range 3 to 9), Pregnant women (range 5 to 20), and Postpartum women (12 weeks only) with the highest range 40 to 65.*
FDA Label Image

Image (9229c82f E84e 4805 90d2 A77e0fad63b5 13)

FDA Label Image

Lable (9229c82f E84e 4805 90d2 A77e0fad63b5 14)

Lable (9229c82f E84e 4805 90d2 A77e0fad63b5 14)
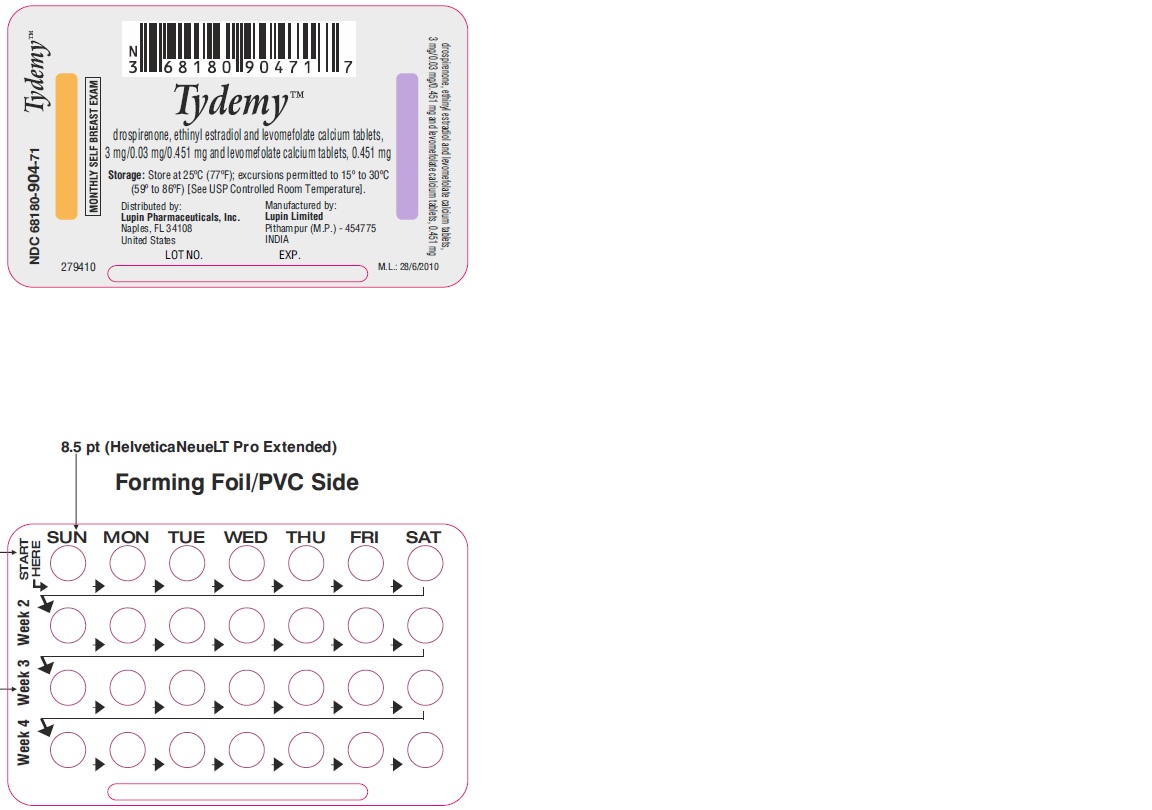
Packaging label for Tydemy tablets by Lupin Pharmaceuticals, Inc. The label includes active ingredients drospirenone, ethinyl estradiol, and levomefolate calcium with strengths 3 mg, 0.03 mg, and 0.451 mg respectively. The label displays storage instructions, manufacturer details (Lupin Limited, India), and a barcode. A foil/PVC blister pack layout for a 28-day monthly self-breast exam schedule is also shown, with days of the week and week numbers listed for daily tablet administration.*
FDA Label Image

Lable (9229c82f E84e 4805 90d2 A77e0fad63b5 15)

Lable (9229c82f E84e 4805 90d2 A77e0fad63b5 15)
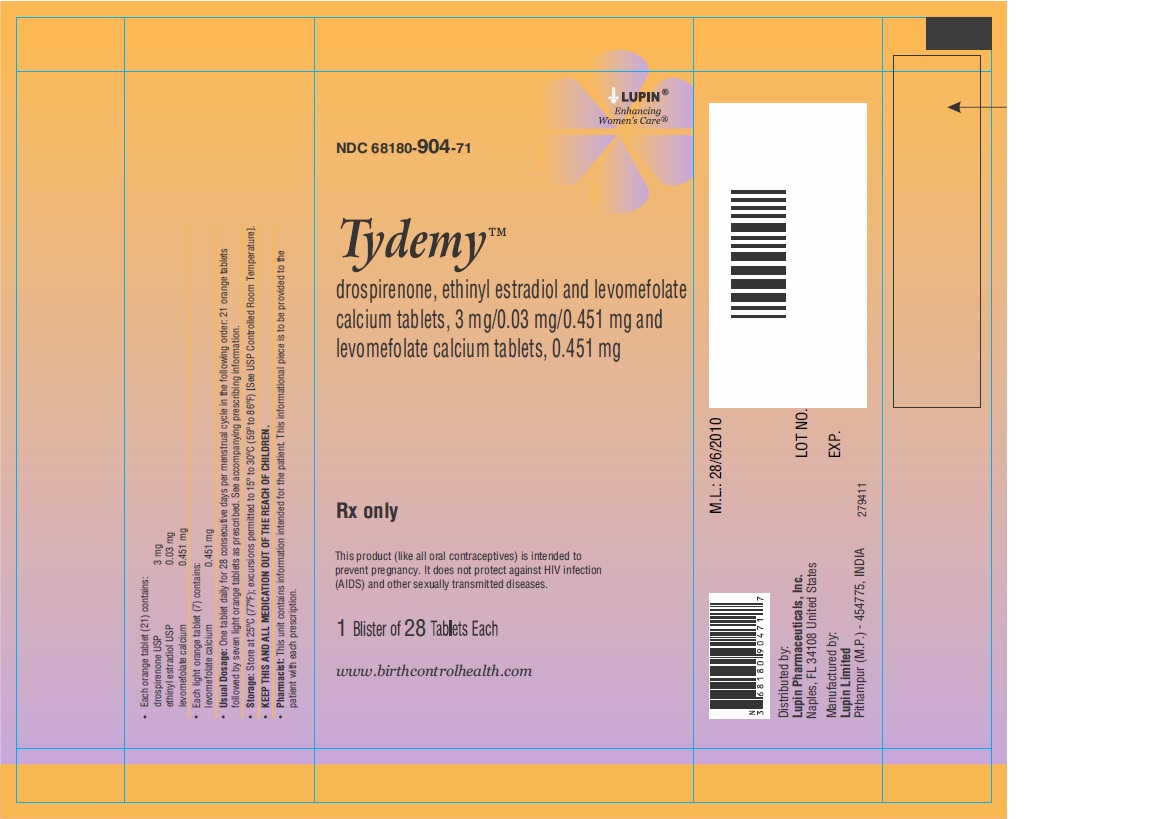
Packaging label for Tydemy tablets containing drospirenone, ethinyl estradiol, and levomefolate calcium with strengths of 3 mg/0.03 mg/0.451 mg and levomefolate calcium 0.451 mg. The label indicates a blister pack of 28 tablets. Distributed and marketed by Lupin Pharmaceuticals, Inc., with manufacturing in India. The label shows the NDC 68180-904-71 and includes barcode and usage information.*
FDA Label Image

Lable (9229c82f E84e 4805 90d2 A77e0fad63b5 16)

Lable (9229c82f E84e 4805 90d2 A77e0fad63b5 16)
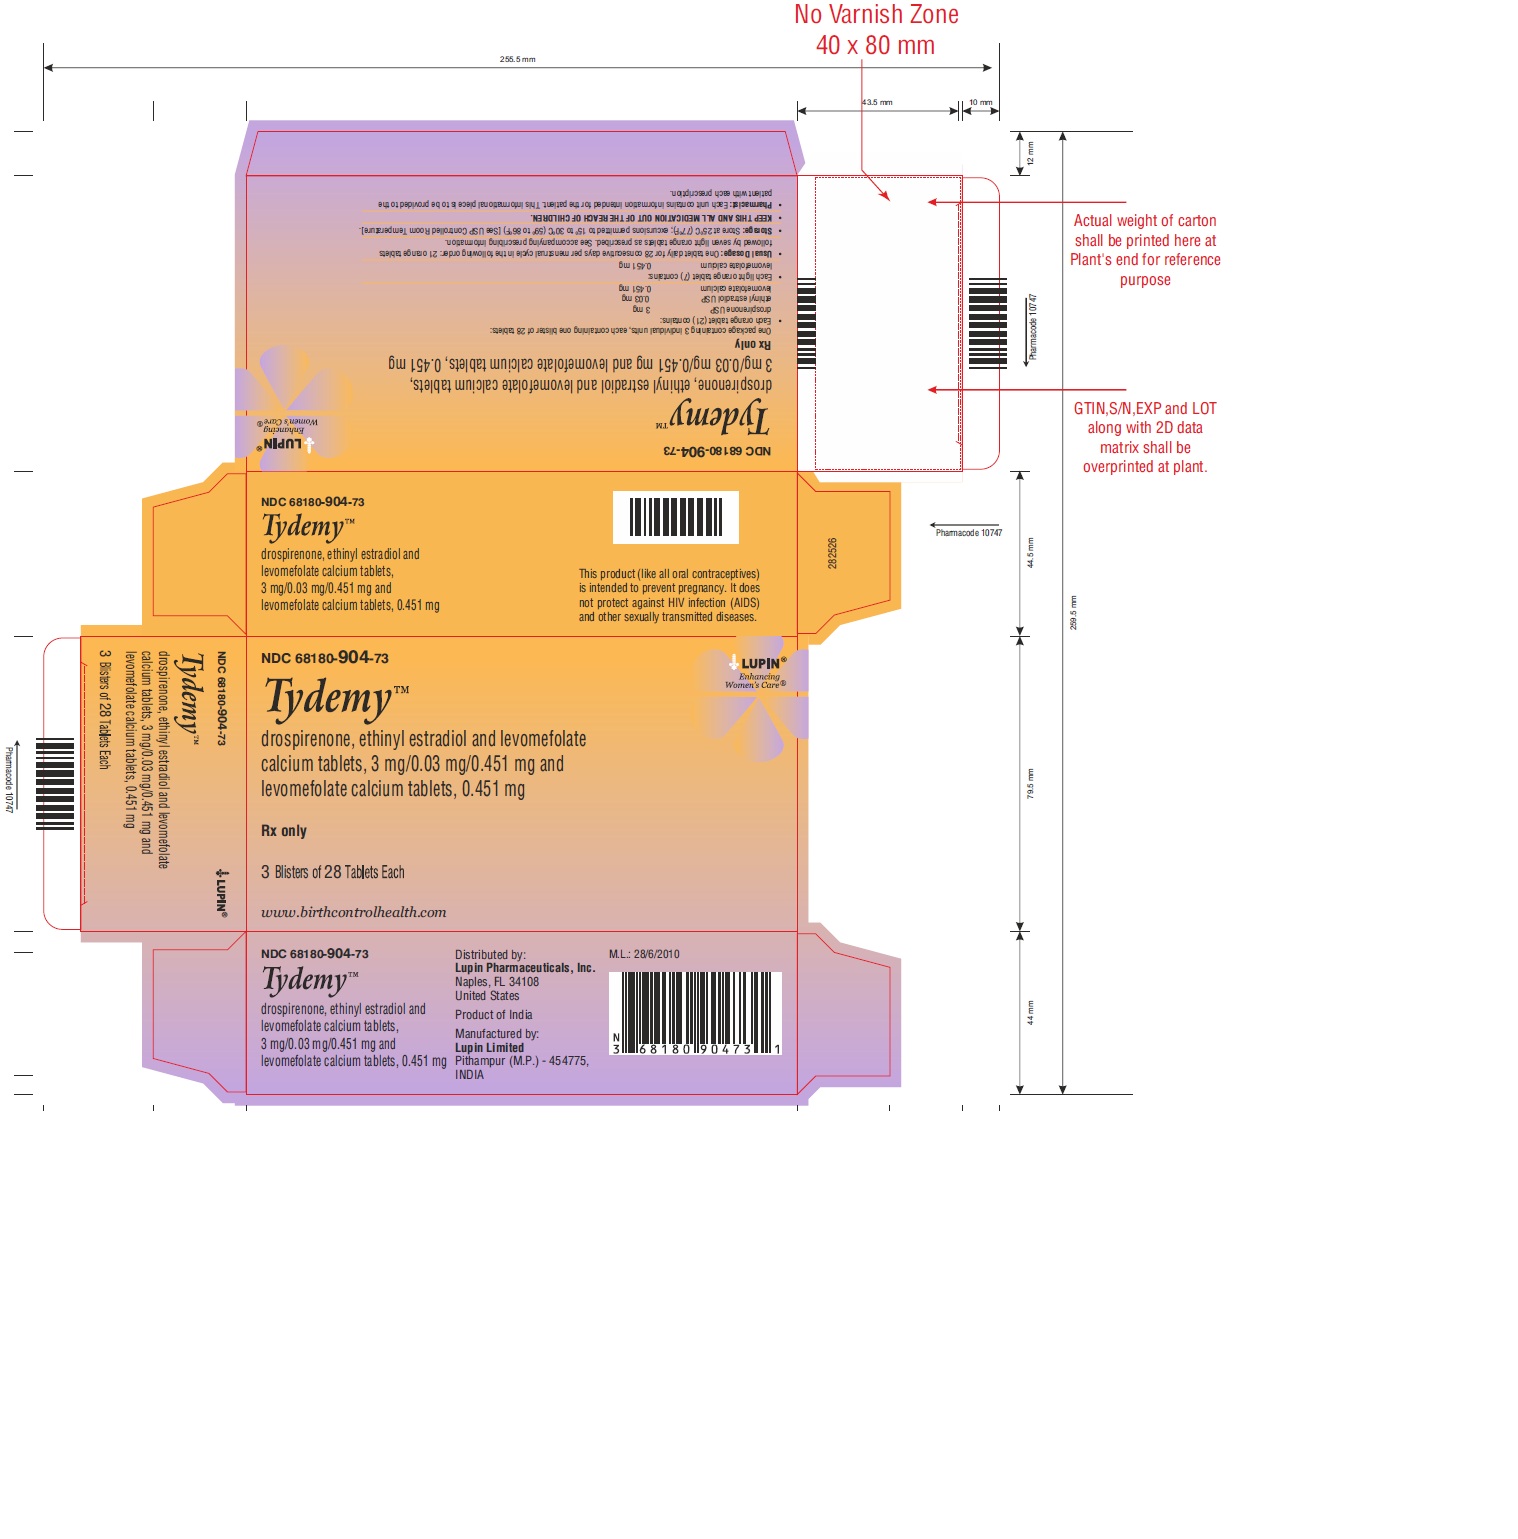
Packaging label for Tydemy oral contraceptive tablets by Lupin Pharmaceuticals, Inc. The box shows Tydemy with active ingredients drospirenone, ethinyl estradiol, and levomefolate calcium. It specifies strengths of 3 mg drospirenone, 0.03 mg ethinyl estradiol, and 0.451 mg levomefolate calcium per tablet, in a package containing 3 blisters of 28 tablets each. Includes barcode, NDC 68180-904-73, and manufacturer information for Lupin Limited, India.*

* About these descriptions: Image descriptions on this page are generated by automated AI analysis of the product label images from the manufacturer's FDA label submission (SPL). They are provided for reference only and may contain errors or omissions. Always rely on the printed label itself and the official FDA labeling, and consult a pharmacist or healthcare professional with any questions about this product.