Levetiracetam
Product Images NDC 68258-7089

View Photos of Packaging, Regulatory Labels, and Product Appearance

Product Visual Gallery

This gallery contains 7 technical images submitted to the FDA as part of the official labeling for Levetiracetam (NDC 68258-7089). Unlike standard consumer photos, these assets often include clinical data figures, molecular chemical structures, and official manufacturer packaging layouts.

As provided by Dispensing Solutions, Inc., these visuals offer a comprehensive scientific overview of the product's physical and chemical identity, aiding pharmacists and researchers in product verification and study.

FDA Label Image

Ndc 68258-7089-xx (Ndc 68258 7089 Xx Aurobindo)
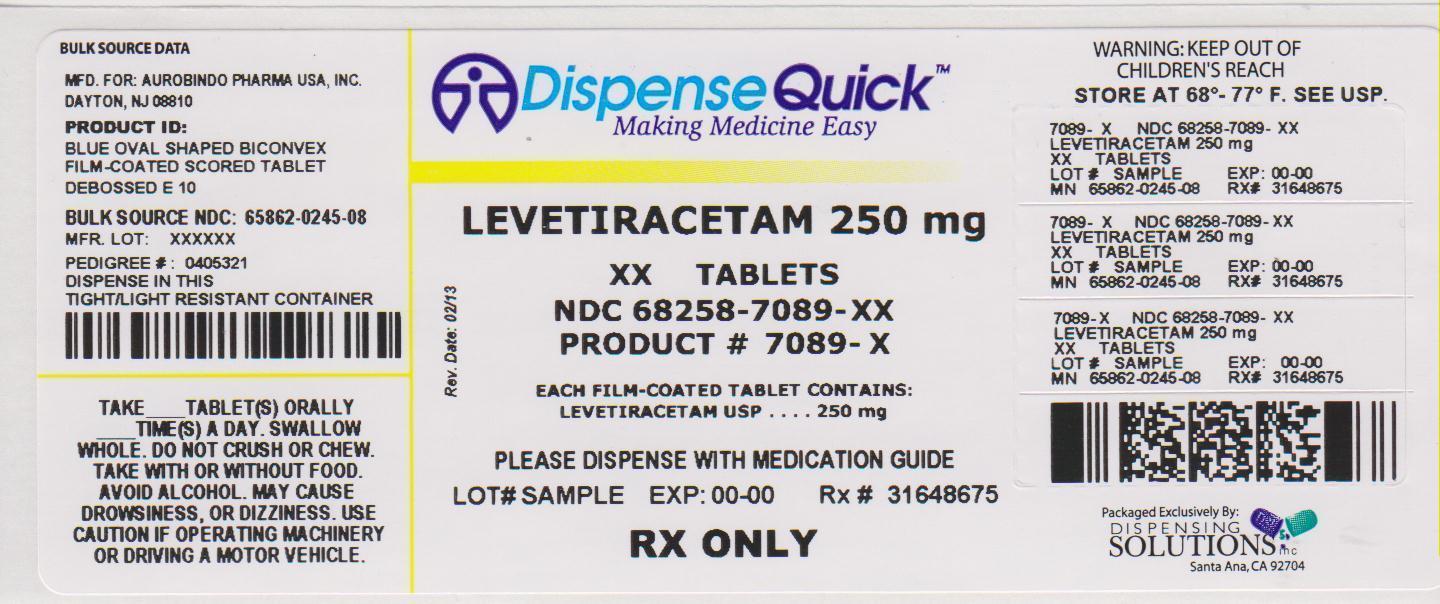
Ndc 68258-7089-xx (Ndc 68258 7089 Xx      Aurobindo)
Levetiracetam 250 mg tablets packaging label from Dispensing Solutions, Inc. The label specifies film-coated tablets with NDC 68258-7089-XX, includes usage instructions, storage conditions, and warnings. The bulk source is Aurobindo Pharma USA, Inc. with detailed product and lot information, along with a barcode and QR code.*
FDA Label Image

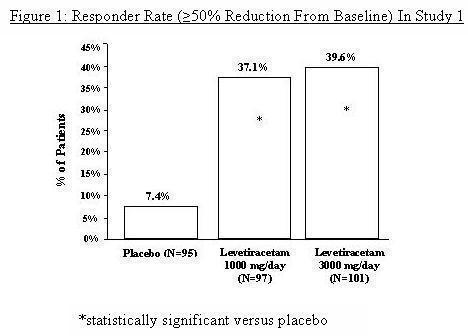
Figure 1 (Levetiracetam Fig1)

Figure 1 (Levetiracetam Fig1)
A bar graph titled 'Responder Rate (≥50% Reduction From Baseline) In Study 1' comparing the percentage of patients responding to placebo and two doses of Levetiracetam. The graph shows response rates for placebo (7.4%), Levetiracetam 1000 mg/day (37.1%), and Levetiracetam 3000 mg/day (39.6%). Statistically significant differences versus placebo are indicated for both Levetiracetam groups.*
FDA Label Image

Figure 2 (Levetiracetam Fig2)

Figure 2 (Levetiracetam Fig2)
A bar chart titled 'Responder Rate (≥50% Reduction From Baseline) In Study 2: Period A' compares the percentage of patients responding to placebo, Levetiracetam 1000 mg/day, and Levetiracetam 2000 mg/day. Percentages shown are 6.3% for placebo, 20.8% for Levetiracetam 1000 mg/day, and 35.2% for Levetiracetam 2000 mg/day with a note indicating statistical significance versus placebo.*
FDA Label Image

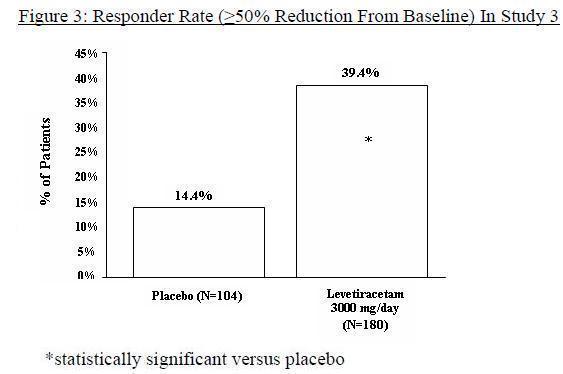
Figure 3 (Levetiracetam Fig3)

Figure 3 (Levetiracetam Fig3)
A bar chart titled 'Figure 3: Responder Rate (>50% Reduction From Baseline) In Study 3' comparing the percentage of patients achieving responder rates between placebo and Levetiracetam 3000 mg/day. The chart shows approximately 14.4% for placebo (N=104) and 39.4% for Levetiracetam (N=180), with a note indicating statistical significance versus placebo.*
FDA Label Image

Figure 4 (Levetiracetam Fig4)

Figure 4 (Levetiracetam Fig4)
A bar graph titled 'Responder Rate (≥50% Reduction From Baseline)' comparing the percentage of patients achieving this response. The graph shows a responder rate of 19.6% for placebo (N=97) and 44.6% for levetiracetam (N=101). A note indicates that the levetiracetam response rate is statistically significant versus placebo.*
FDA Label Image

Figure 5 (Levetiracetam Fig5)

Figure 5 (Levetiracetam Fig5)
A bar graph showing responder rates (≥50% reduction from baseline) in primary generalized tonic-clonic (PGTC) seizure frequency per week. The graph compares placebo (45.2% responders, N=84) and levetiracetam (72.2% responders, N=79), with a statistical significance notation indicating levetiracetam's higher responder rate versus placebo.*
FDA Label Image

Chemical Structure (Levetiracetam Str)

Chemical Structure (Levetiracetam Str)
Chemical structure diagram of Levetiracetam showing its molecular framework with labeled atomic groups, including a pyrrolidone ring and a methyl-substituted carbon connected to an amide group.*

* About these descriptions: Image descriptions on this page are generated by automated AI analysis of the product label images from the manufacturer's FDA label submission (SPL). They are provided for reference only and may contain errors or omissions. Always rely on the printed label itself and the official FDA labeling, and consult a pharmacist or healthcare professional with any questions about this product.