Novolog
Product Images NDC 68258-8899

View Photos of Packaging, Regulatory Labels, and Product Appearance

Product Visual Gallery

This gallery contains 31 technical images submitted to the FDA as part of the official labeling for Novolog (NDC 68258-8899). Unlike standard consumer photos, these assets often include clinical data figures, molecular chemical structures, and official manufacturer packaging layouts.

As provided by Dispensing Solutions, Inc., these visuals offer a comprehensive scientific overview of the product's physical and chemical identity, aiding pharmacists and researchers in product verification and study.

FDA Label Image

Fig. 1 (Structural Formula of Insulin Aspart)
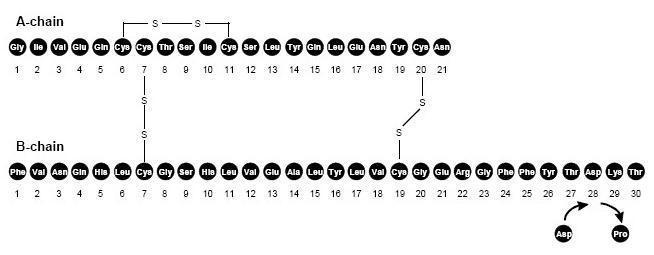
Fig. 1 (Structural Formula of Insulin Aspart)
Chemical structure diagram showing the amino acid sequences and disulfide bonds of the A-chain and B-chain of a protein. The A-chain consists of 21 amino acids, and the B-chain consists of 30 amino acids, with lines indicating disulfide bonds connecting specific cysteine residues between and within the chains.*
FDA Label Image

Fig. 2 (Pharmacodynamics Graph showing Maximum Glucose-Lowering Effect of NovoLog)

Fig. 2 (Pharmacodynamics Graph showing Maximum Glucose-Lowering Effect of NovoLog)
A line graph depicting serum glucose levels (mg/dL) over time (hours). The graph shows two curves representing changes in glucose concentration from 0 to 6 hours, with the vertical axis ranging roughly from 0 to 300 mg/dL and the horizontal axis from 0 to 6 hours.*
FDA Label Image

Fig. 3 (Pharmacodynamics Graph)

Fig. 3 (Pharmacodynamics Graph)
A line graph depicting mean blood glucose levels (mg/dL) over time in minutes. The x-axis ranges from 0 to R+60 minutes with slashes indicating jumps in time, and the y-axis measures blood glucose from 0 to 180 mg/dL. Two curves with error bars show changes in glucose levels before and after the reference time point (R).*
FDA Label Image

Fig. 4 (Pharmacokinetics Graph showing Bioavailability and Absorption of NovoLog)

Fig. 4 (Pharmacokinetics Graph showing Bioavailability and Absorption of NovoLog)
A line graph showing free serum insulin concentration (mU/L) over time in hours (h). The solid and dashed lines compare two different profiles of insulin levels, with a peak around the first hour followed by a gradual decline over six hours.*
FDA Label Image

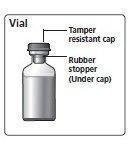
Vial Figure (70e689b2 1ad1 4632 B851 B38b7ee6e14f 05)

Vial Figure (70e689b2 1ad1 4632 B851 B38b7ee6e14f 05)
Illustration showing a vial with labeled components including a tamper resistant cap and a rubber stopper beneath the cap.*
FDA Label Image

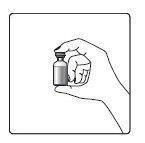
Hand And Vial Figure (70e689b2 1ad1 4632 B851 B38b7ee6e14f 06)

Hand And Vial Figure (70e689b2 1ad1 4632 B851 B38b7ee6e14f 06)
An instructional line drawing showing a hand holding a small vial between the thumb and fingers. This diagram likely illustrates proper handling or positioning of a vial related to the NovoLog product by Dispensing Solutions, Inc.*
FDA Label Image

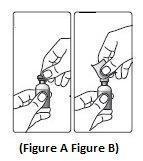
Figure A And Figure B (70e689b2 1ad1 4632 B851 B38b7ee6e14f 07)

Figure A And Figure B (70e689b2 1ad1 4632 B851 B38b7ee6e14f 07)
An instructional illustration labeled Figure A and Figure B demonstrating the process of removing a cap from a vial. The images show hands holding a vial with a stopper and lifting off the cap.*
FDA Label Image

Figure C (70e689b2 1ad1 4632 B851 B38b7ee6e14f 08)

Figure C (70e689b2 1ad1 4632 B851 B38b7ee6e14f 08)
An instructional illustration showing a hand holding a syringe and inserting it into a vial, likely depicting the step of drawing medication from the vial. A smaller inset shows a close-up of the syringe filled with liquid.*
FDA Label Image

Figure D (70e689b2 1ad1 4632 B851 B38b7ee6e14f 09)

Figure D (70e689b2 1ad1 4632 B851 B38b7ee6e14f 09)
An instructional illustration labeled Figure D showing two hands manipulating a syringe. One hand holds the syringe barrel while the other hand is attaching or detaching a needle or cap. The image is a simple black and white line drawing focusing on the correct handling of the syringe.*
FDA Label Image

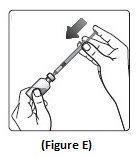
Figure E (70e689b2 1ad1 4632 B851 B38b7ee6e14f 10)

Figure E (70e689b2 1ad1 4632 B851 B38b7ee6e14f 10)
An instructional illustration labeled "Figure E" showing hands assembling or preparing a syringe with an arrow indicating direction, likely part of medication administration guidance.*
FDA Label Image

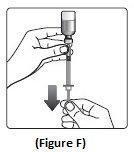
Figure F (70e689b2 1ad1 4632 B851 B38b7ee6e14f 11)

Figure F (70e689b2 1ad1 4632 B851 B38b7ee6e14f 11)
An instructional illustration showing a hand holding a vial upright above a syringe, with the other hand pulling down the plunger of the syringe. An arrow indicates the downward movement of the syringe plunger, likely demonstrating the step to draw liquid from the vial into the syringe.*
FDA Label Image

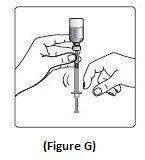
Figure G (70e689b2 1ad1 4632 B851 B38b7ee6e14f 12)

Figure G (70e689b2 1ad1 4632 B851 B38b7ee6e14f 12)
An instructional diagram labeled Figure G showing hands holding a syringe and vial. The image depicts the process of drawing medication from a vial into a syringe, illustrating one hand holding the vial upside down while the other hand operates the syringe plunger.*
FDA Label Image

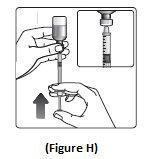
Figure H (70e689b2 1ad1 4632 B851 B38b7ee6e14f 13)

Figure H (70e689b2 1ad1 4632 B851 B38b7ee6e14f 13)
An instructional diagram showing a hand holding a vial and drawing liquid into a syringe, with an arrow indicating the upward direction of the vial. A close-up inset shows the syringe barrel with liquid inside. This illustration likely demonstrates the proper technique for drawing medication into a syringe, related to NovoLog.*
FDA Label Image

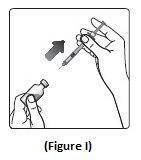
Figure I (70e689b2 1ad1 4632 B851 B38b7ee6e14f 14)

Figure I (70e689b2 1ad1 4632 B851 B38b7ee6e14f 14)
An instructional illustration showing a hand holding a vial with an arrow indicating the vial should be tilted. A syringe is being inserted into the vial by the other hand, demonstrating preparation of an injection. The image is labeled as Figure I.*
FDA Label Image

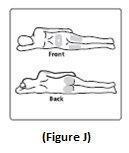
Figure J (70e689b2 1ad1 4632 B851 B38b7ee6e14f 15)

Figure J (70e689b2 1ad1 4632 B851 B38b7ee6e14f 15)
Illustration showing a person lying down in two positions: front (face up) and back (face down) views. This figure is labeled as Figure J and is likely part of an instructional or anatomical diagram related to the NovoLog product.*
FDA Label Image

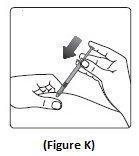
Figure K (70e689b2 1ad1 4632 B851 B38b7ee6e14f 16)

Figure K (70e689b2 1ad1 4632 B851 B38b7ee6e14f 16)
An instructional illustration showing hands holding a syringe with an arrow pointing downward, likely indicating an action to be performed on the syringe, such as removing air or preparing the syringe for injection. The figure is labeled as Figure K.*
FDA Label Image

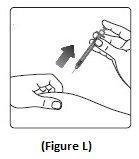
Figure L (70e689b2 1ad1 4632 B851 B38b7ee6e14f 17)

Figure L (70e689b2 1ad1 4632 B851 B38b7ee6e14f 17)
An instructional illustration showing two hands: one holding and lifting a cap from a needle or syringe, and the other hand placed on an arm, indicating preparation for an injection. The figure is labeled as Figure L.*
FDA Label Image

Instructions For Use (NovoLog FlexPen)

Instructions For Use (NovoLog FlexPen)
An illustration diagram showing parts of the NovoLog FlexPen insulin delivery device by Dispensing Solutions, Inc. It labels components including the pen cap, rubber stopper, cartridge, cartridge scale, pointer, dose selector, dose window, and push button. The image also shows the NovoFine needle assembly with its big outer needle cap, inner needle cap, needle, and protective tab.*
FDA Label Image

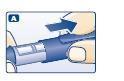
A (Preparing the NovoLog FlexPen)

A (Preparing the NovoLog FlexPen)
An instructional illustration showing a person holding and preparing an insulin pen device for use. The image depicts a hand gripping the pen with a blue cap being removed or adjusted, likely indicating the initial preparation step of the injection process for NovoLog, an insulin product.*
FDA Label Image

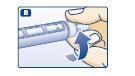
B (Attaching the Needle)

B (Attaching the Needle)
An instructional illustration showing a hand twisting or turning the cap or needle cover of a NovoLog insulin syringe or pen. The image emphasizes the motion with arrows to guide the user on how to remove or attach the component properly.*
FDA Label Image

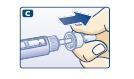
C (Pulling off the big outer needle cap)

C (Pulling off the big outer needle cap)
An instructional illustration showing a hand holding and connecting two components of a syringe-like device, with an arrow indicating the direction to twist or connect the parts.*
FDA Label Image

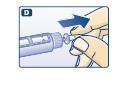
D (Pulling off the inner needle cap)

D (Pulling off the inner needle cap)
Illustration depicting the action of inserting or removing a cartridge or component into/from a pen injector device. A hand is shown holding the pen and performing the step indicated by a blue arrow.*
FDA Label Image

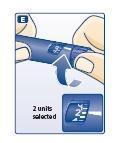
E (Giving the airshot before each injection- Turn the dose selector to select 2 units)

E (Giving the airshot before each injection- Turn the dose selector to select 2 units)
An instructional diagram showing a close-up of a hand adjusting a dial on a NovoLog insulin delivery pen, selecting a dose of 2 units. The image emphasizes dose selection with a zoomed-in inset highlighting the selected units on the pen's dose window.*
FDA Label Image

F (Giving the airshot before each injection)

F (Giving the airshot before each injection)
Illustration showing a hand holding a syringe with a safety shield mechanism, highlighting the activation of the needle shield on the syringe tip to prevent needle stick injuries.*
FDA Label Image

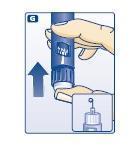
G (Giving the airshot before each injection)

G (Giving the airshot before each injection)
An instructional illustration showing a hand holding a blue NovoLog insulin pen in preparation. The pen is being pulled upward to remove the cap, revealing the tip and needle connector. Below, a small inset depicts the pen needle being attached to the pen.*
FDA Label Image

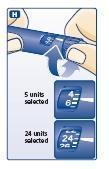
H (Selecting the dose)

H (Selecting the dose)
An instructional illustration showing the dosage selector on a NovoLog insulin pen by Dispensing Solutions, Inc. It demonstrates selecting 5 units and 24 units of insulin, highlighting settings on the dosage window of the pen.*
FDA Label Image

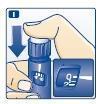
I (Giving the injection)

I (Giving the injection)
Illustration showing a hand pressing down on the top of a blue pen device, with a close-up inset of the pen tip, indicating a step in using the NovoLog insulin delivery pen.*
FDA Label Image

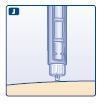
J (Giving the injection)

J (Giving the injection)
An instructional illustration showing the tip of an insulin delivery pen positioned just above the skin. The pen is depicted with a visible needle, demonstrating injection technique or device use related to NovoLog insulin delivery.*
FDA Label Image

K (After the injection)

K (After the injection)
An instructional illustration showing a person holding a pen-like device, demonstrating how to unlock or prepare the device for use by pushing or pressing a blue mechanism. The image appears related to a step in using a medication delivery pen, possibly NovoLog.*
FDA Label Image

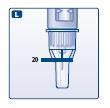
L (Function Check)

L (Function Check)
An instructional illustration showing a close-up of a syringe needle cap being removed or adjusted, with a focus on holding the cap at the indicated position marked by the number 20.*
FDA Label Image

Ndc 68258-8899-03 (Ndc 68258 8899 03 Novo)

Ndc 68258-8899-03 (Ndc 68258 8899 03      Novo)
Label for NovoLog FlexPen 100 units/mL (U-100) insulin aspart injection in a 3 mL prefilled insulin syringe. The label includes detailed ingredient information, manufacturer Novo Nordisk A/S in Denmark, and dispenser Dispensing Solutions, Inc. It features storage instructions, usage warnings, lot number sample, and is marked RX only.*

* About these descriptions: Image descriptions on this page are generated by automated AI analysis of the product label images from the manufacturer's FDA label submission (SPL). They are provided for reference only and may contain errors or omissions. Always rely on the printed label itself and the official FDA labeling, and consult a pharmacist or healthcare professional with any questions about this product.